Ink to Infrastructure: Uncovering Newspaper Sentiments on India’s PMGSYRural Road Infrastructure Program 103
- Aug 11, 2026
- 149 views

Abstract
The Pradhan Mantri Gram Sadak Yojana (PMGSY), launched in 2000, represents one of India’s most ambitious rural infrastructure efforts, aiming to connect eligible villages with durable, all-weather roads. Drawing on 14 Factiva export files from the same search/download sequence of Englishlanguage newspaper coverage, this study analyzes 968 outlet-attributed articles after text extraction, de-duplication, and source classification. VADER sentiment analysis is used to quantify media framing over time, across outlets, across state-linked city editions, and around a 2015 reform period. The results indicate generally positive English-language press sentiment toward PMGSY, substantial outlet-level and state-linked variations, weak spatial clustering, and no robust evidence that national ruling-party affiliation or BJP-governed state status systematically shifted coverage tone. The analysis therefore contributes to the framing of governmental infrastructure programs while also emphasizing that the English-language print media capture elite media discourse, not the full range of rural or regional-language public opinions.
Full Text
Introduction
The Pradhan Mantri Gram Sadak Yojana (PMGSY) emerged in December 2000 as a landmark central government initiative to address India’s pervasive rural road deficit. Prior to PMGSY’s rollout, nearly half of India’s 600,000 villages lacked reliable all-weather connectivity, particularly during monsoon seasons when unpaved roads became impassable. Policymakers allocated nearly ₹60,000 crores (~US $20 billion) across central and state budgets to construct more than 180,000 kilometers of rural roads by 2020. This required extensive coordination among the Ministry of Rural Development, state public works departments, district authorities, and local Gram Panchayats, which are India’s local village governments, leading to an extremely complex delivery of new infrastructure.
Existing research generally finds substantial benefits from rural road construction, ranging from poverty alleviation to improved health outcomes 1,5,161,5,16 While infrastructure projects often navigate complex political realities and corruption 1717 , Asher and Novosad 33 offer one of the most rigorous causal evaluations of PMGSY's economic impact, employing a difference- in- differences strategy on matched habitations. They report that within three years of road completion, connected villages exhibit meaningful improvements in agricultural outcomes, primarily driven by lower transport costs and reduced travel times. Datta 99 extends the impact narrative by analyzing PMGSY's effect on nonfarm employment and informal enterprise performance, showing that rural road density can reduce transport costs, elevate non- farm employment, and increase rural wages. Binswanger, Khandker, and Rosenzweig6 provide a theoretical foundation by conceptualizing rural roads as public goods that reduce transaction costs, enhance information flows, and catalyze private investment. Government sources, including the Ministry of Rural Development's Basic Road Statistics of India 1111 and the PMGSY Annual Progress Report 2020 , document road length, quality, maintenance cycles, and implementation milestones. Yet these sources largely examine delivery and socioeconomic effects rather than the public narratives through which PMGSY is presented. This creates an important gap: media coverage can frame infrastructure as technical achievement, political credit- claiming, local development, corruption risk, or administrative delay. A systematic analysis of press sentiment therefore complements the existing impact- evaluation literature by showing how PMGSY is represented in elite public discourse.
Entman's framing theory 1010 delineates four core frame elements—problem definition, causal interpretation, moral evaluation, and treatment recommendation—through which media narratives shape audience perceptions. In social- policy domains, human- interest and conflict frames often outcompete technical frames in audience salience 8,238,23 , a dynamic particularly evident in India's highly competitive, multilingual press environment 19,2519,25 . No prior study applies framing theory to PMGSY coverage, leaving questions unanswered about how narratives emphasizing developmental benefits versus bureaucratic challenges have evolved. As a result, three gaps become evident. First, rigorous impact evaluations confirm PMGSY's economic and social returns but do not examine how media narratives may influence program legitimacy and public buy- in. Second, institutional reviews highlight administrative lessons but omit systematic press analysis. Third, theoretical framing models remain largely untested on PMGSY's national and city- edition coverage.
This study addresses those gaps through three research questions: (RQ1) How has English- language media sentiment toward PMGSY changed since the program's inception? (RQ2) How do Times of India city editions compare with national newspapers in coverage tone? (RQ3) Is sentiment associated with national ruling- party control or with a post- 2015 reform- period shift in BJP- governed states? By answering these questions, the study provides an empirical examination of PMGSY's media portrayal while clarifying the limits of English- language print media as evidence of broader public sentiment.
Materials and Methods
The empirical foundation of this study is a reproducible text- analysis pipeline, consistent with text- as- data research practices, that transforms Factiva PDF export files into an analyzable corpus of PMGSY news articles12. The analysis begins with 14 Factiva PDF export files from the same underlying search/download sequence, containing English- language newspaper coverage. Because Factiva search- summary fields record search hits rather than the final analyzable corpus, the article count is reported through an explicit attrition funnel: 1,539 raw article segments were extracted, 18 duplicates were removed, and 968 articles remained after unmatched outlets were dropped (Figure 1).
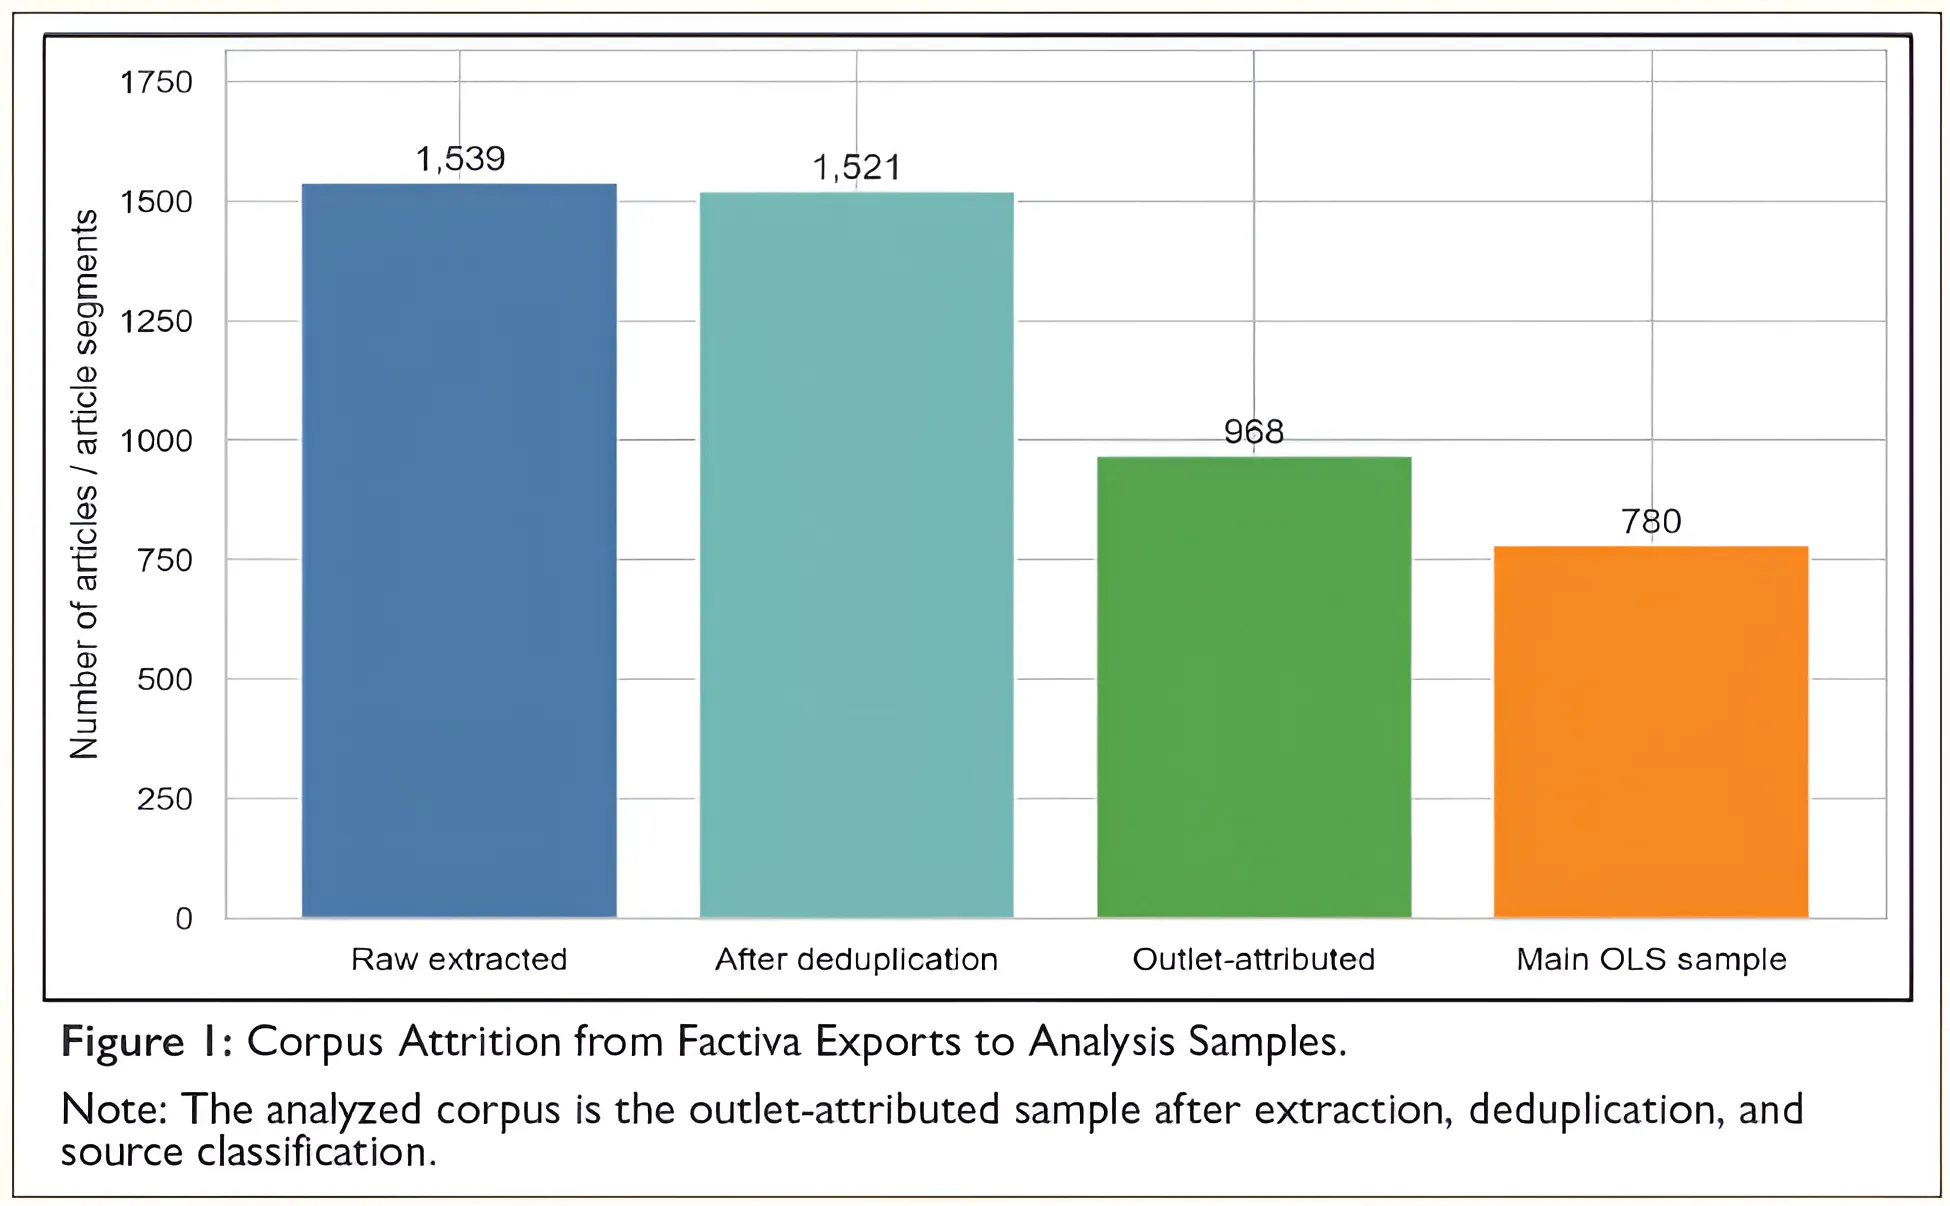
This distinction is important because search hits, downloaded PDFs, extractable article segments, deduplicated records, and outlet- attributed articles are not the same quantity. The text extraction process reads PDF text, segments article- length passages using Factiva- style boundaries, assigns outlet labels from source identifiers, parses article dates, and retains a short excerpt of article text for auditability, using standard text- processing and tabular- data tools7,18. Articles whose outlet could not be identified are excluded from outlet- level and regression analyses. This approach preserves the substantive logic of the original data collection while making the final analyzed number of articles (N) transparent and reproducible.
Sentiment analysis serves as the baseline for all subsequent analysis and uses VADER (Valence Aware Dictionary and sEntiment Reasoner), a rule- based lexicon model designed to score text along positive, negative, neutral, and composite sentiment dimensions4,14,24. The composite score is a normalized weighted measure that ranges from - 1 (most negative) to + 1 (most positive), and it is the primary dependent variable in this study. VADER is useful for this project because it provides a transparent, replicable measure of polarity across a large text corpus. At the same time, its limitations are important: lexicon- based models can miss sarcasm, context- specific political meanings, regional idioms, and issue- specific frames in Indian media. For that reason, the results are
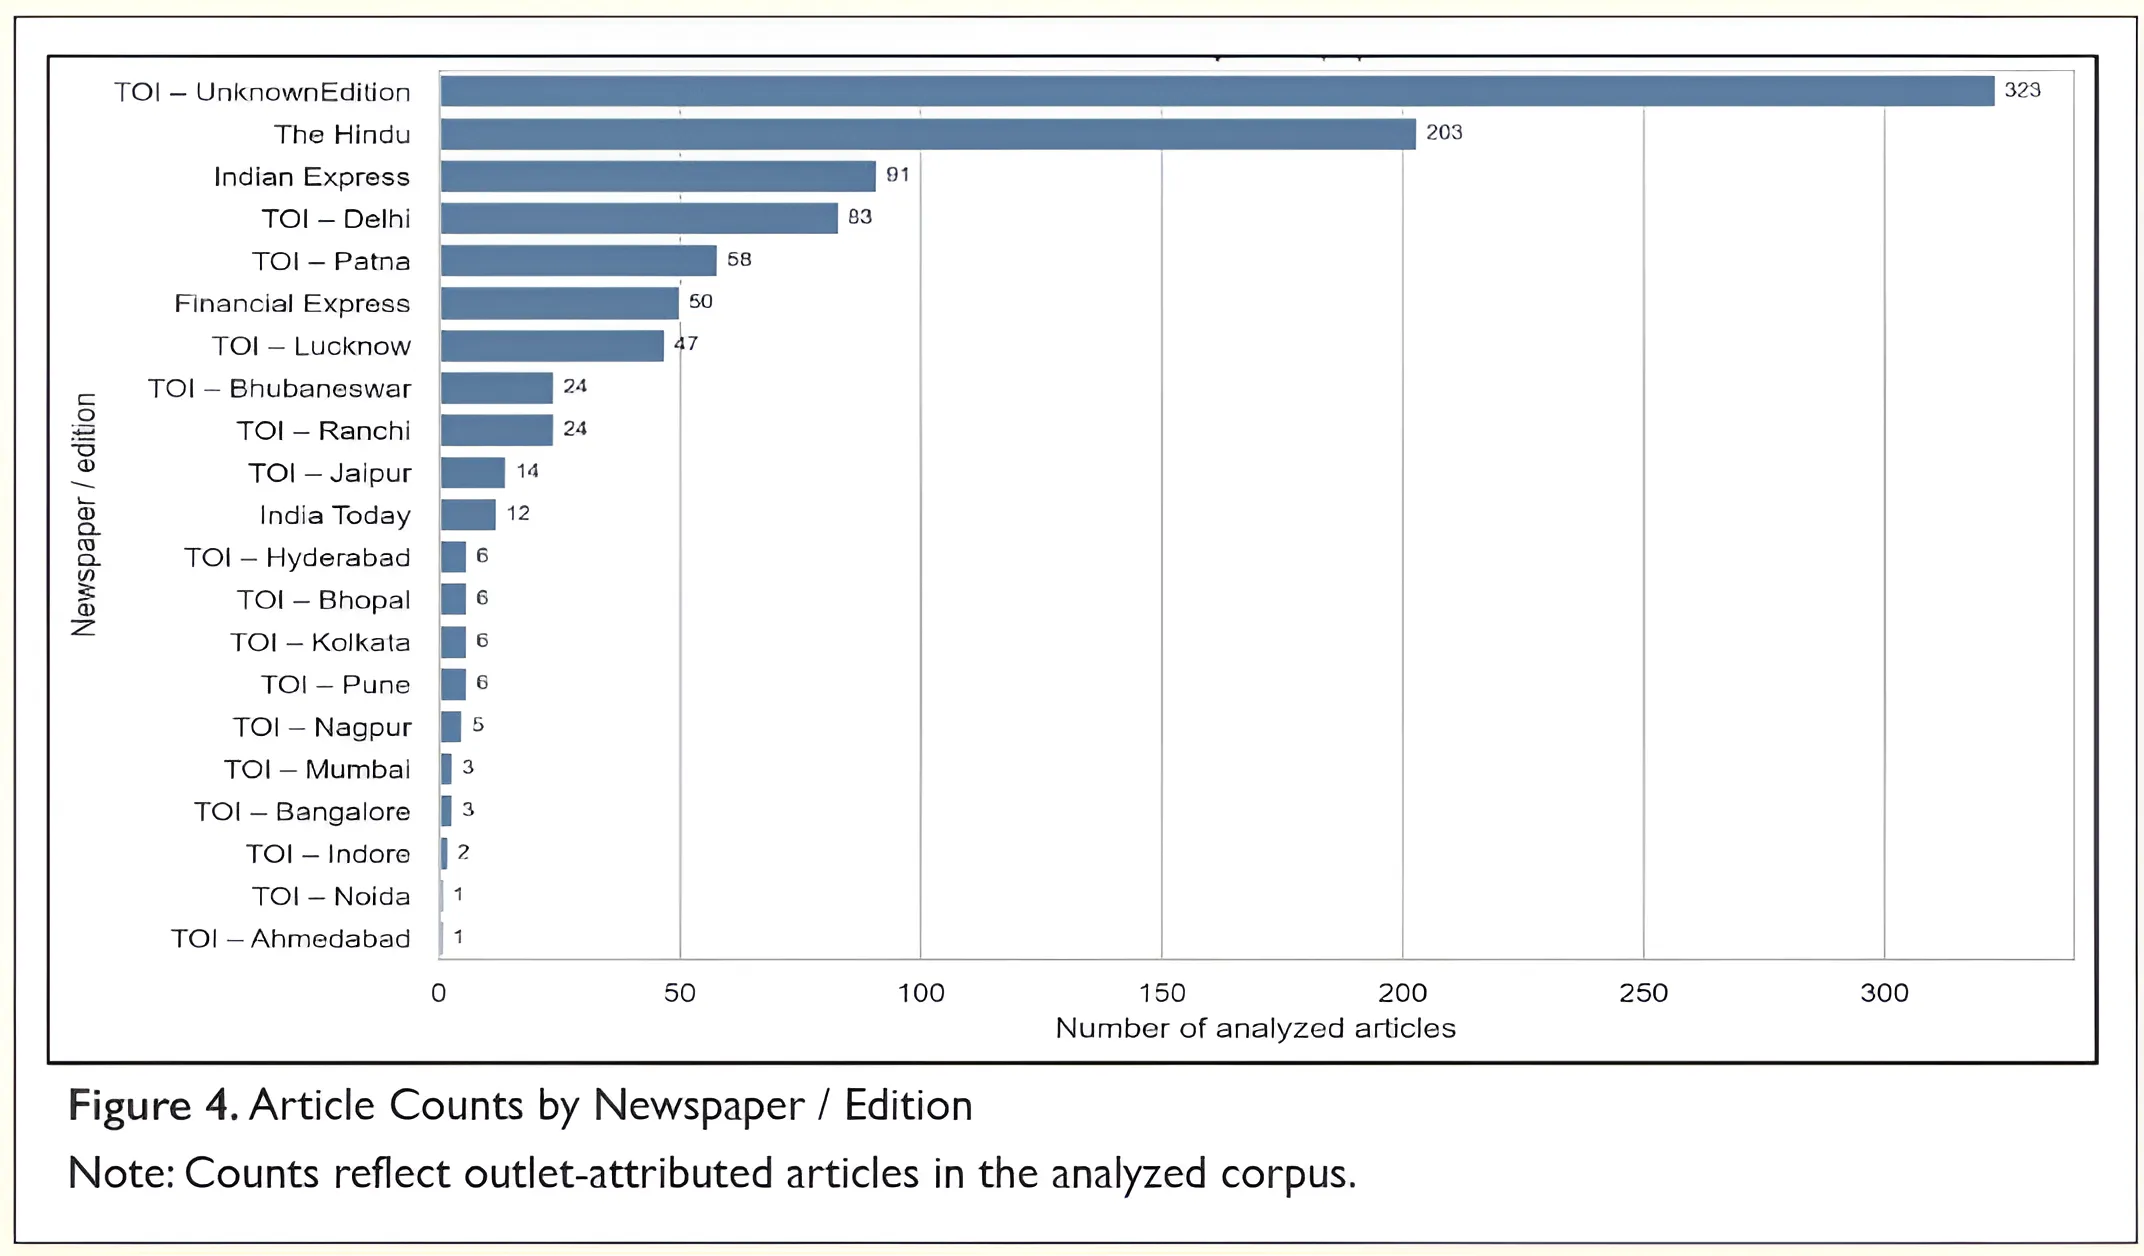
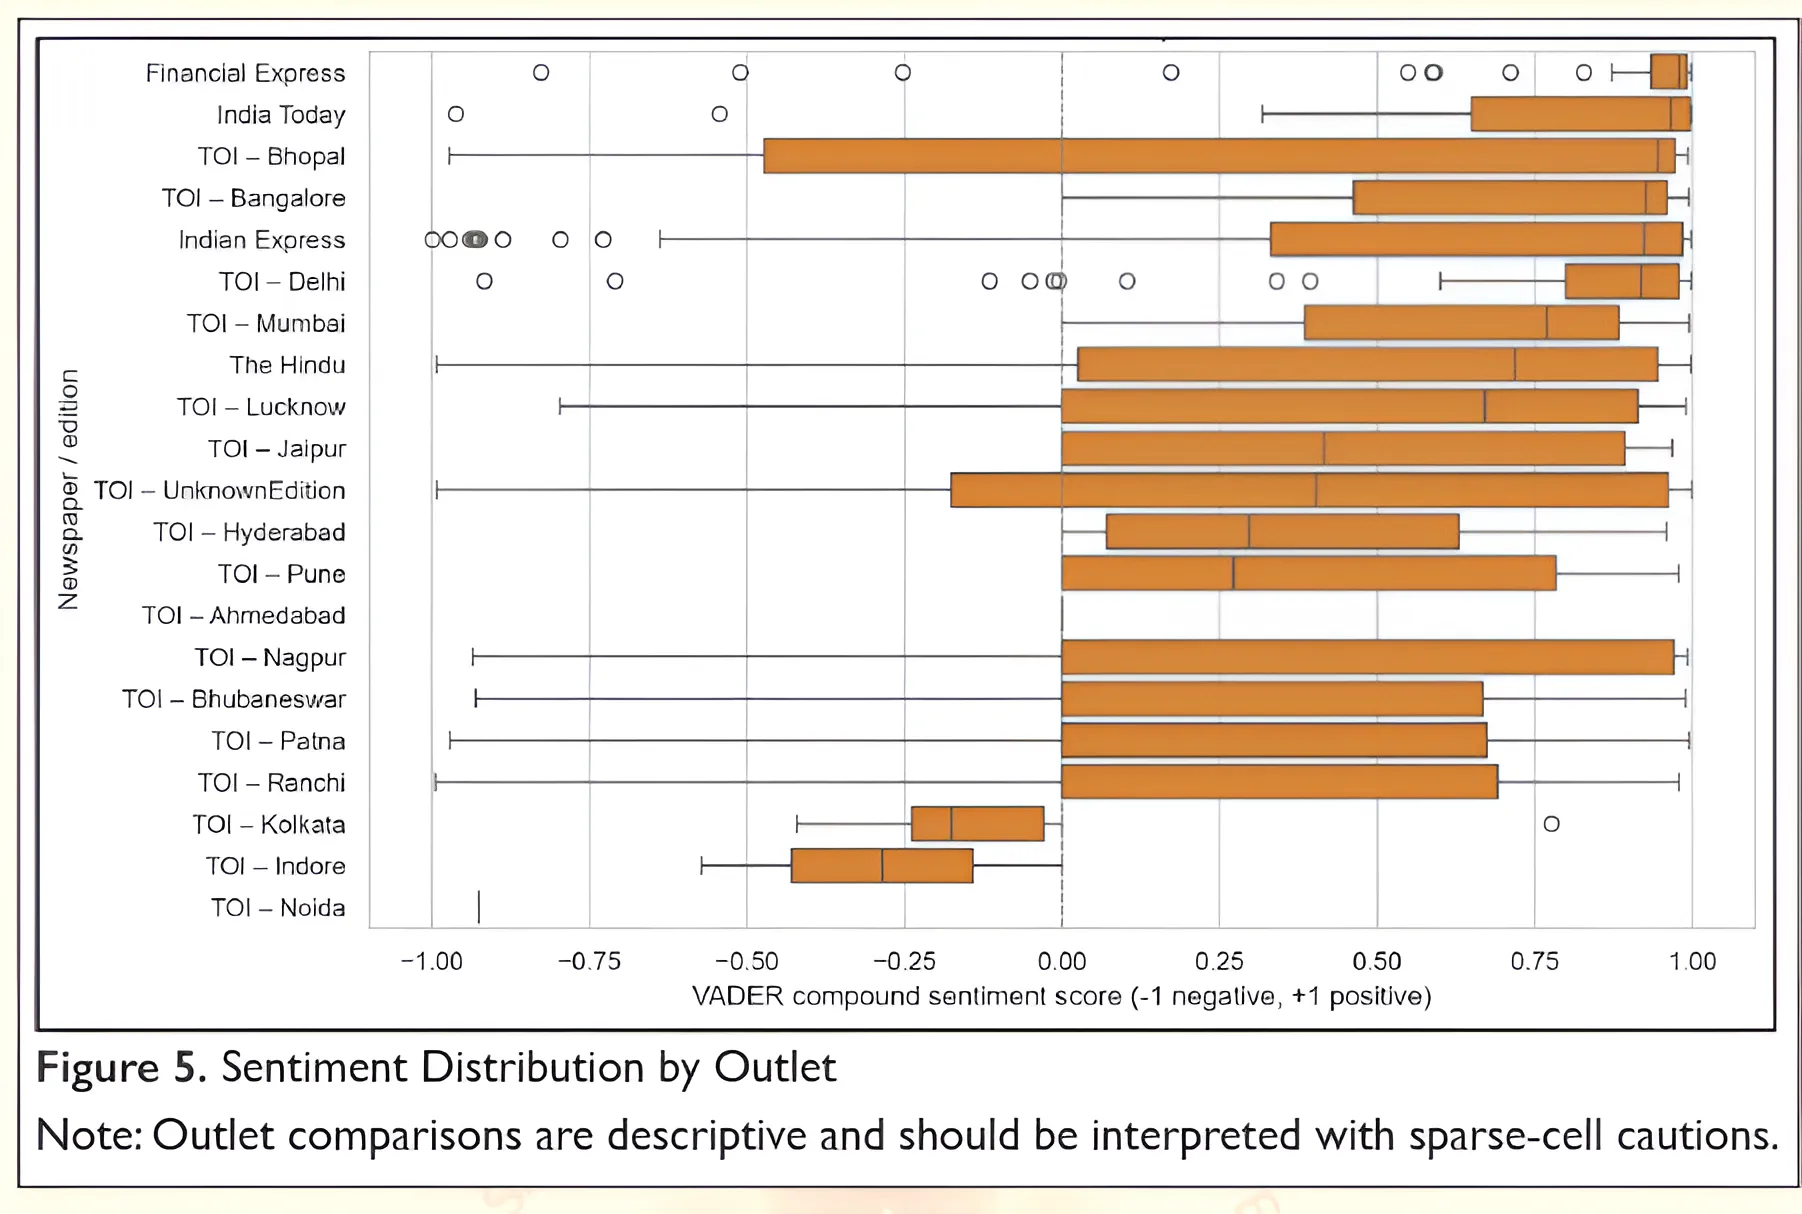
interpreted as measured tone in English- language newspaper text rather than as direct evidence of public opinion. The article- level dataset includes the article date, identified newspaper outlet or city edition, sentiment scores, state mapping where available, national ruling- party period, and a short article excerpt used for verification. For visual displays, sparse TOI city editions are treated consistently: TOI- Ahmedabad (n=1)(n=1) , TOI- Bangalore (n=3)(n=3) , and other very low- count editions are retained in article- count summaries but excluded from distribution or trend figures that require minimum support.
Statistical Analysis
The statistical analysis combines descriptive visualization, spatial analysis, and regression models. State- level averages are calculated from mapped TOI city editions and visualized alongside a Moran's I statistic to assess whether neighboring states show similar average sentiment2- 13,15,21. The core regression is estimated using OLS with cluster- robust standard errors grouped by newspaper outlet22; the dependent variable is the VADER compound sentiment score, and the model includes newspaper edition and year fixed effects alongside ruling- party period. OLS is used as a descriptive linear summary, not as a claim that sentiment scores are normally distributed. Because the VADER compound score is bounded and skewed, the analysis reports distributional diagnostics and an asinh- transformed robustness check. Multicollinearity is assessed using variance inflation factors and condition- number diagnostics. These diagnostics are central to the interpretation: the fully saturated model contains substantial collinearity between ruling- party period and year fixed effects, so parsimonious no- party and no- year specifications serve as robustness checks. Coverage- intensity analyses test whether state- year article counts predict mean sentiment. A difference- in- differences analysis around the March 2015 reform date compares post- reform changes in BJP- governed states with other mapped states. Since treatment status is time- invariant within state, and TOI city editions map one- to- one onto states in this corpus, the stand- alone treatment indicator is omitted when state or newspaper fixed effects are included; only post- reform timing and the post- by- treatment interaction are identified. Event- study diagnostics assess pre- period support and parallel- trends limitations.
The corpus provenance deserves particular emphasis because it affects the interpretation of every empirical result. Factiva's search interface reports search- hit metadata, but those hits are not the same as articles that can be extracted, segmented, deduplicated, attributed to an outlet, and linked to a valid date. Treating search hits as the analyzed corpus would overstate the empirical base and make the regression sample appear larger than it is. The revised manuscript therefore distinguishes between raw search/export metadata and the final analytic sample. This distinction is not merely technical; it clarifies the scope of inference. The study can speak to the tone of articles that were successfully extracted and attributed to English- language outlets, but it cannot claim to represent all PMGSY- related search hits, all Indian media coverage, or all public discourse around rural roads.
The decision to retain OLS as the main modeling strategy is also interpretive rather than mechanical. The VADER compound score is bounded between - 1 and + 1 and is not normally distributed, so the model should not be read as a perfect data- generating process for sentiment. Instead, it is used as a transparent summary of conditional mean differences across party periods, outlets, and years. In a sample of this size, non- normality of the dependent variable is less damaging for estimating average linear associations than it would be for small- sample inference, especially when the manuscript is careful not to overclaim causality; this follows standard large- sample treatments of OLS inference26. The distributional diagnostics and asinh robustness check are reported so readers can evaluate how much weight to place on the linear specification.
The difference- in- differences design is included because the 2015 reform period provides a useful temporal benchmark, but the design is deliberately framed as a diagnostic comparison rather than a standalone causal proof. Treatment is defined at the state level as BJP governance at the reform date, while the observable media units are state- linked TOI city editions. That structure creates two important constraints. First, the standalone treatment indicator is collinear with state fixed effects and also with city- edition fixed effects in this sample. Second, the number of treated state- year cells is limited. The revised analysis therefore drops the collinear treatment main effect, reports the full post- by- treatment estimate, and uses event- study support tables to show where the identifying variation is thin.
Results
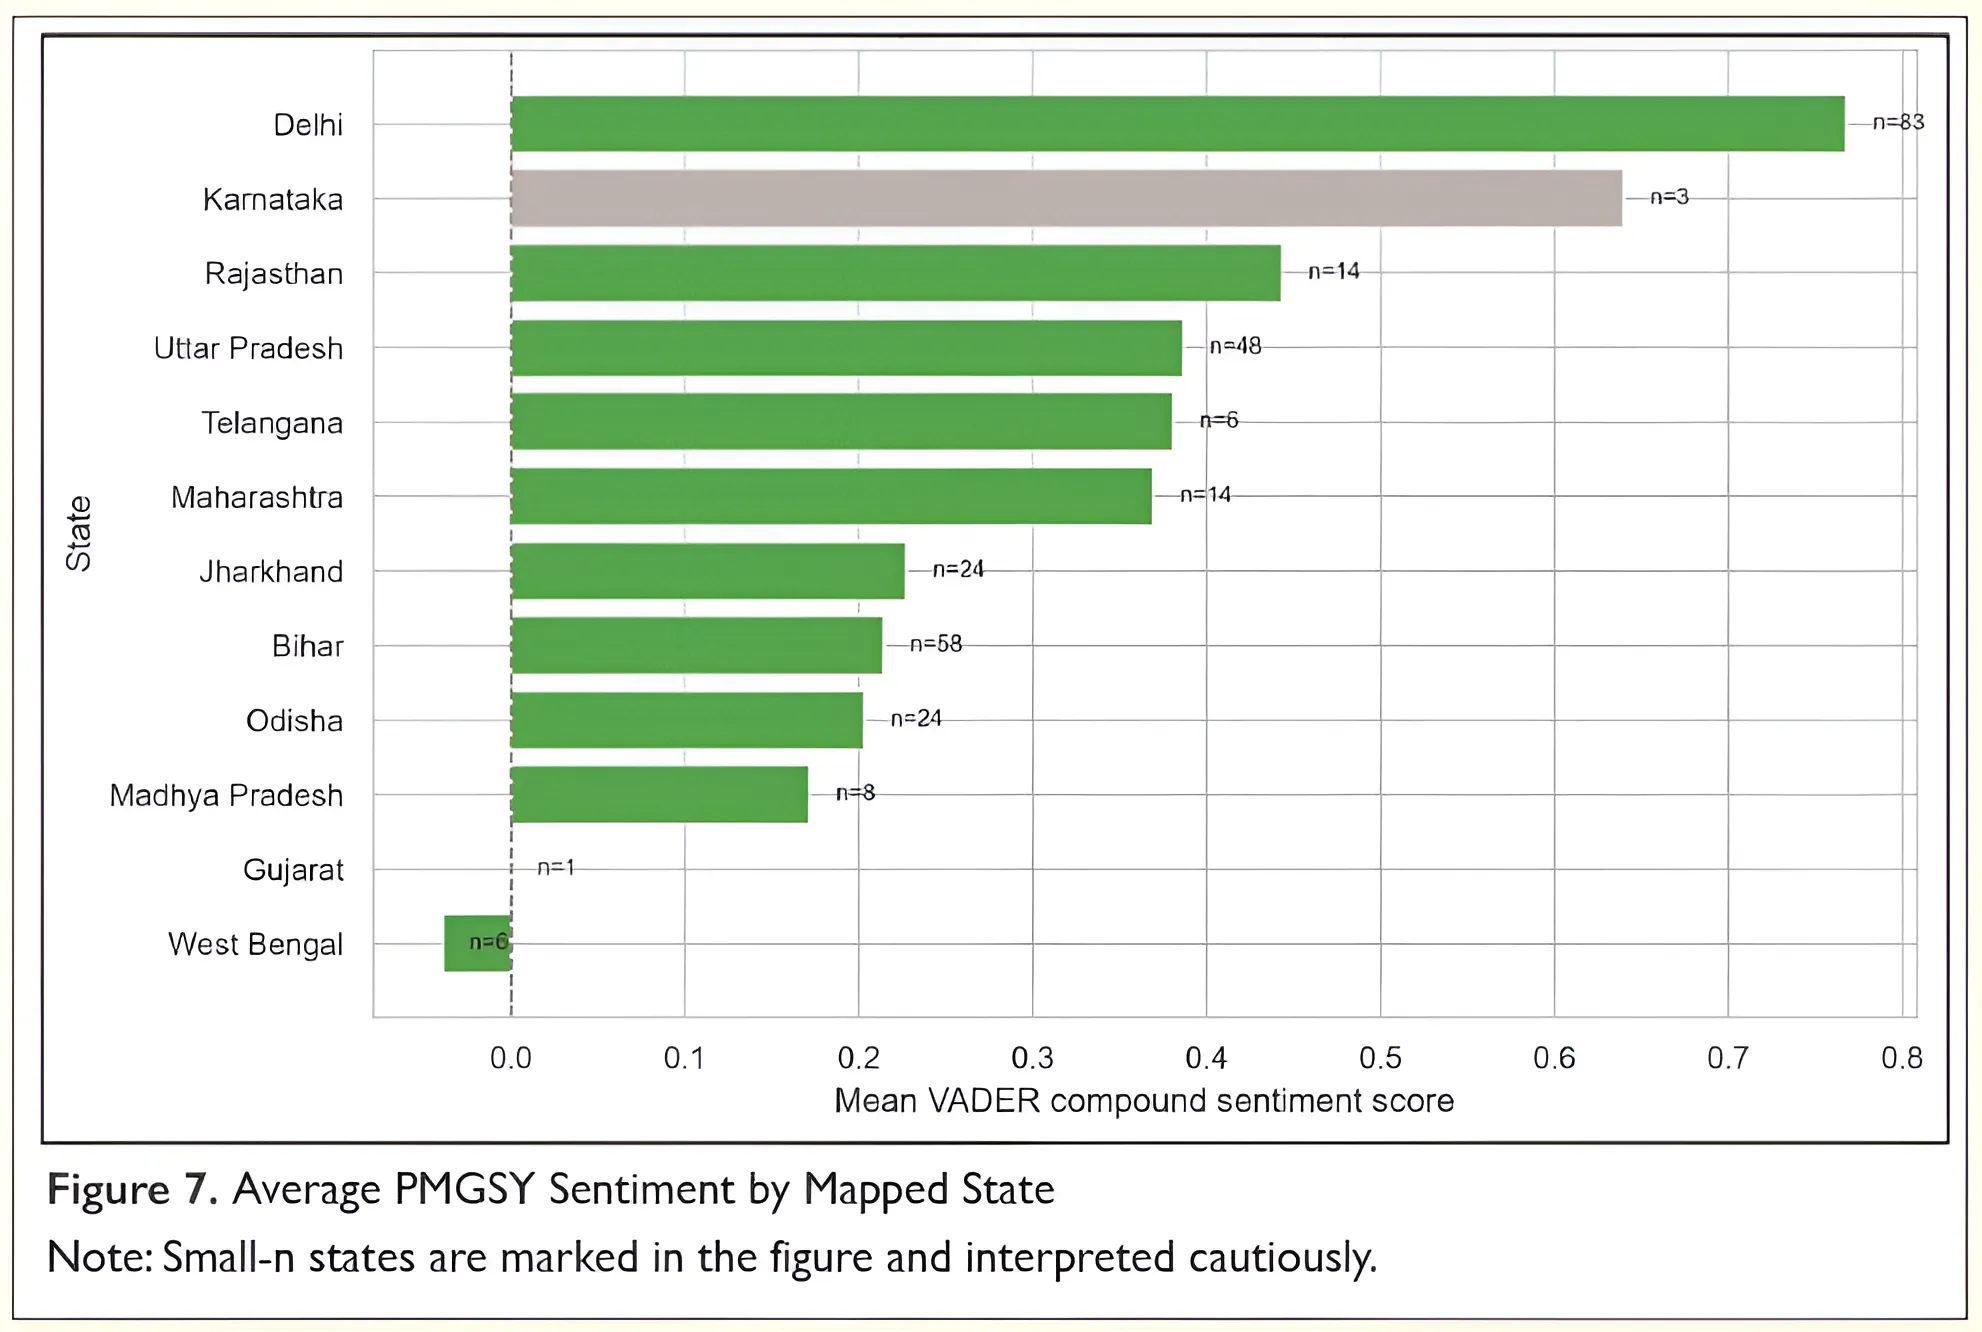
Guided by the research questions introduced above, the results first describe broad patterns in PMGSY coverage across outlets and city editions. Across the 968 outlet- attributed articles, coverage is generally positive, although the degree of positivity varies substantially by outlet and state- linked edition (Figures 2, 4, and 5). Among mapped states, Delhi has the highest mean sentiment (0.768
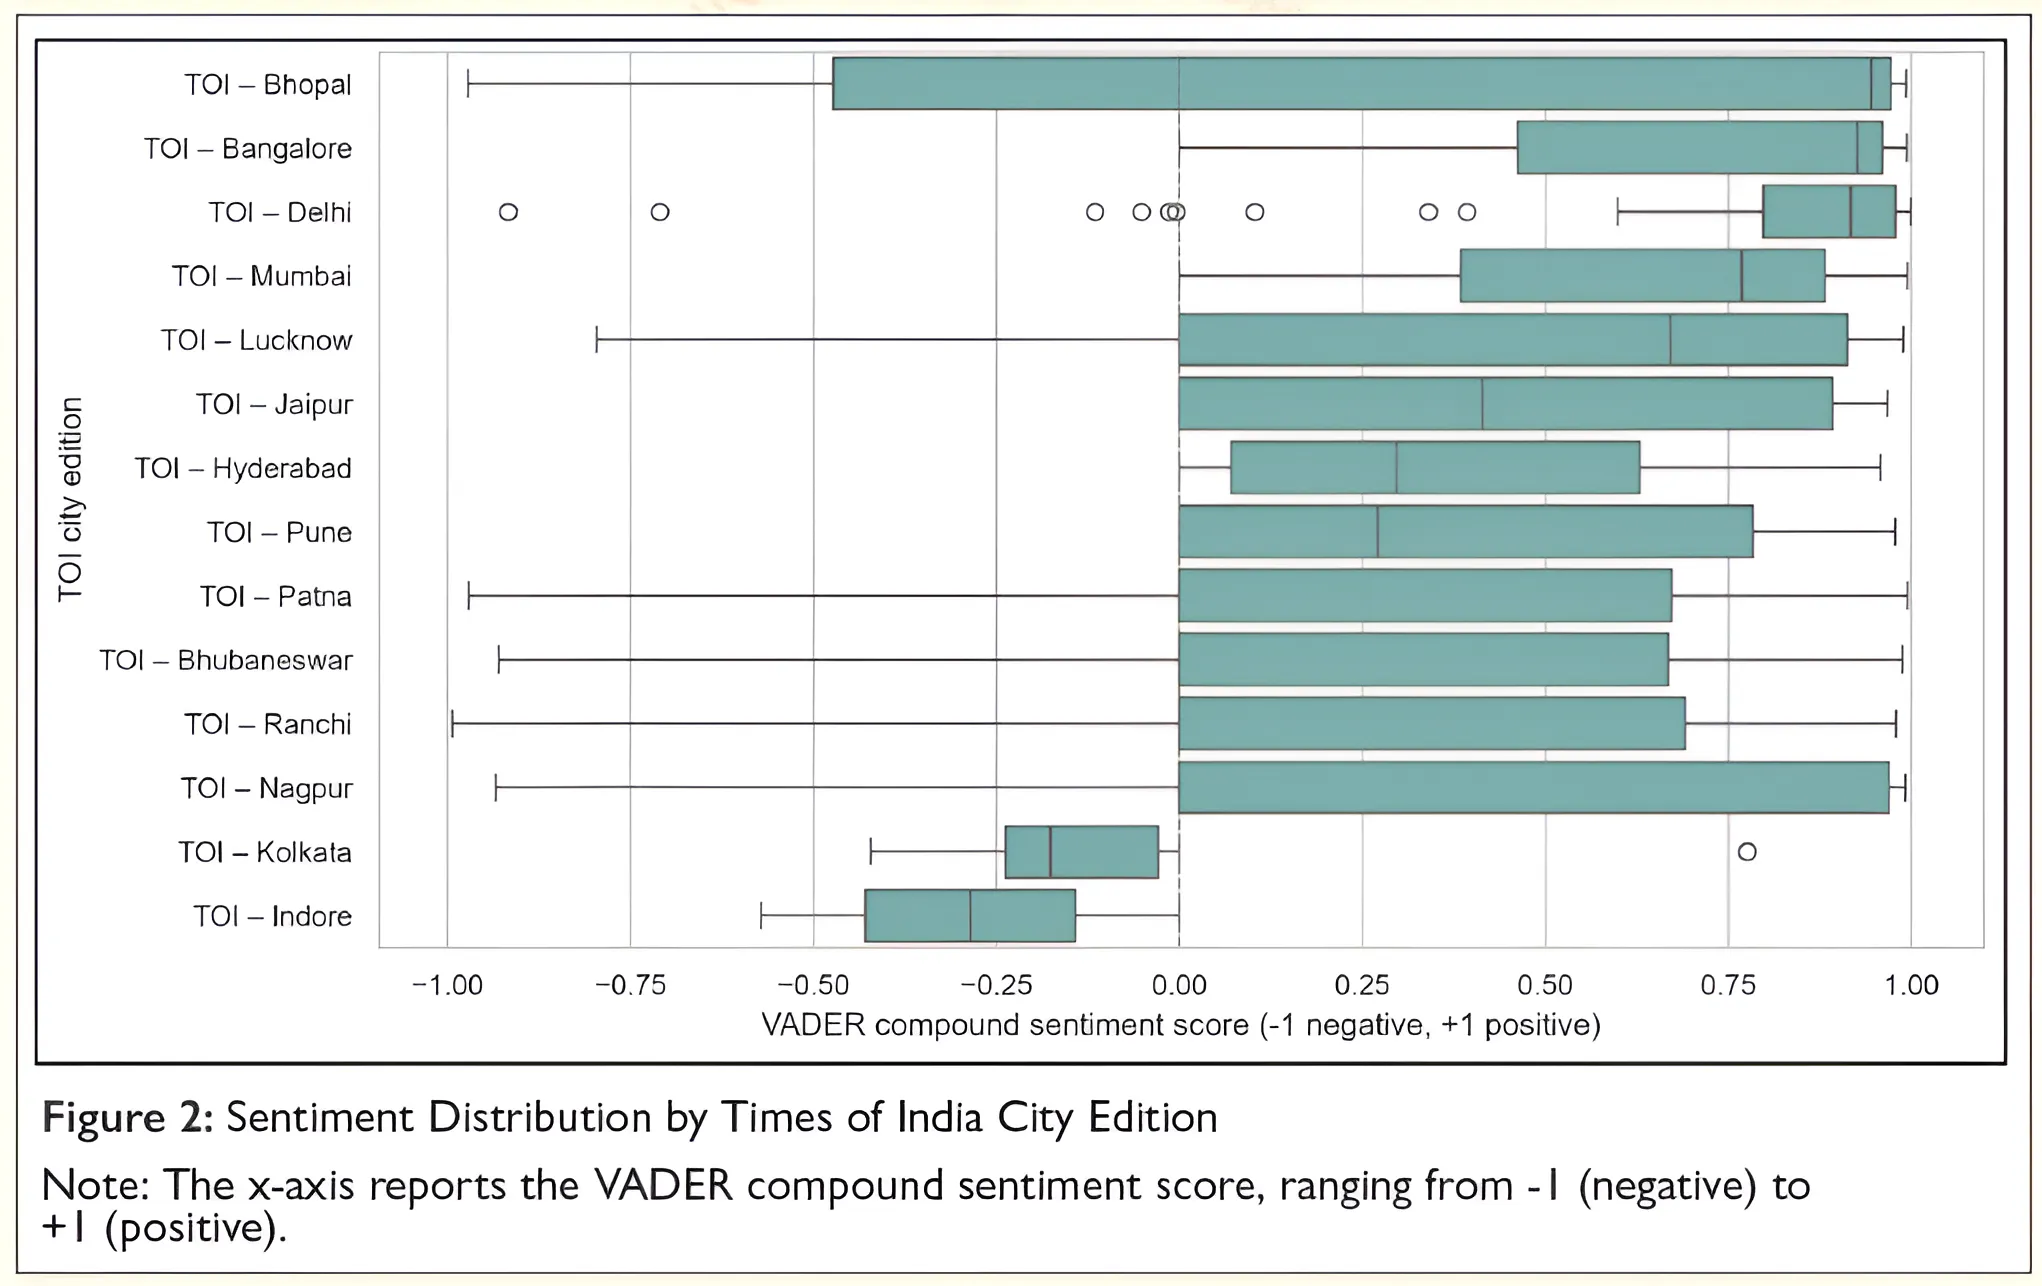
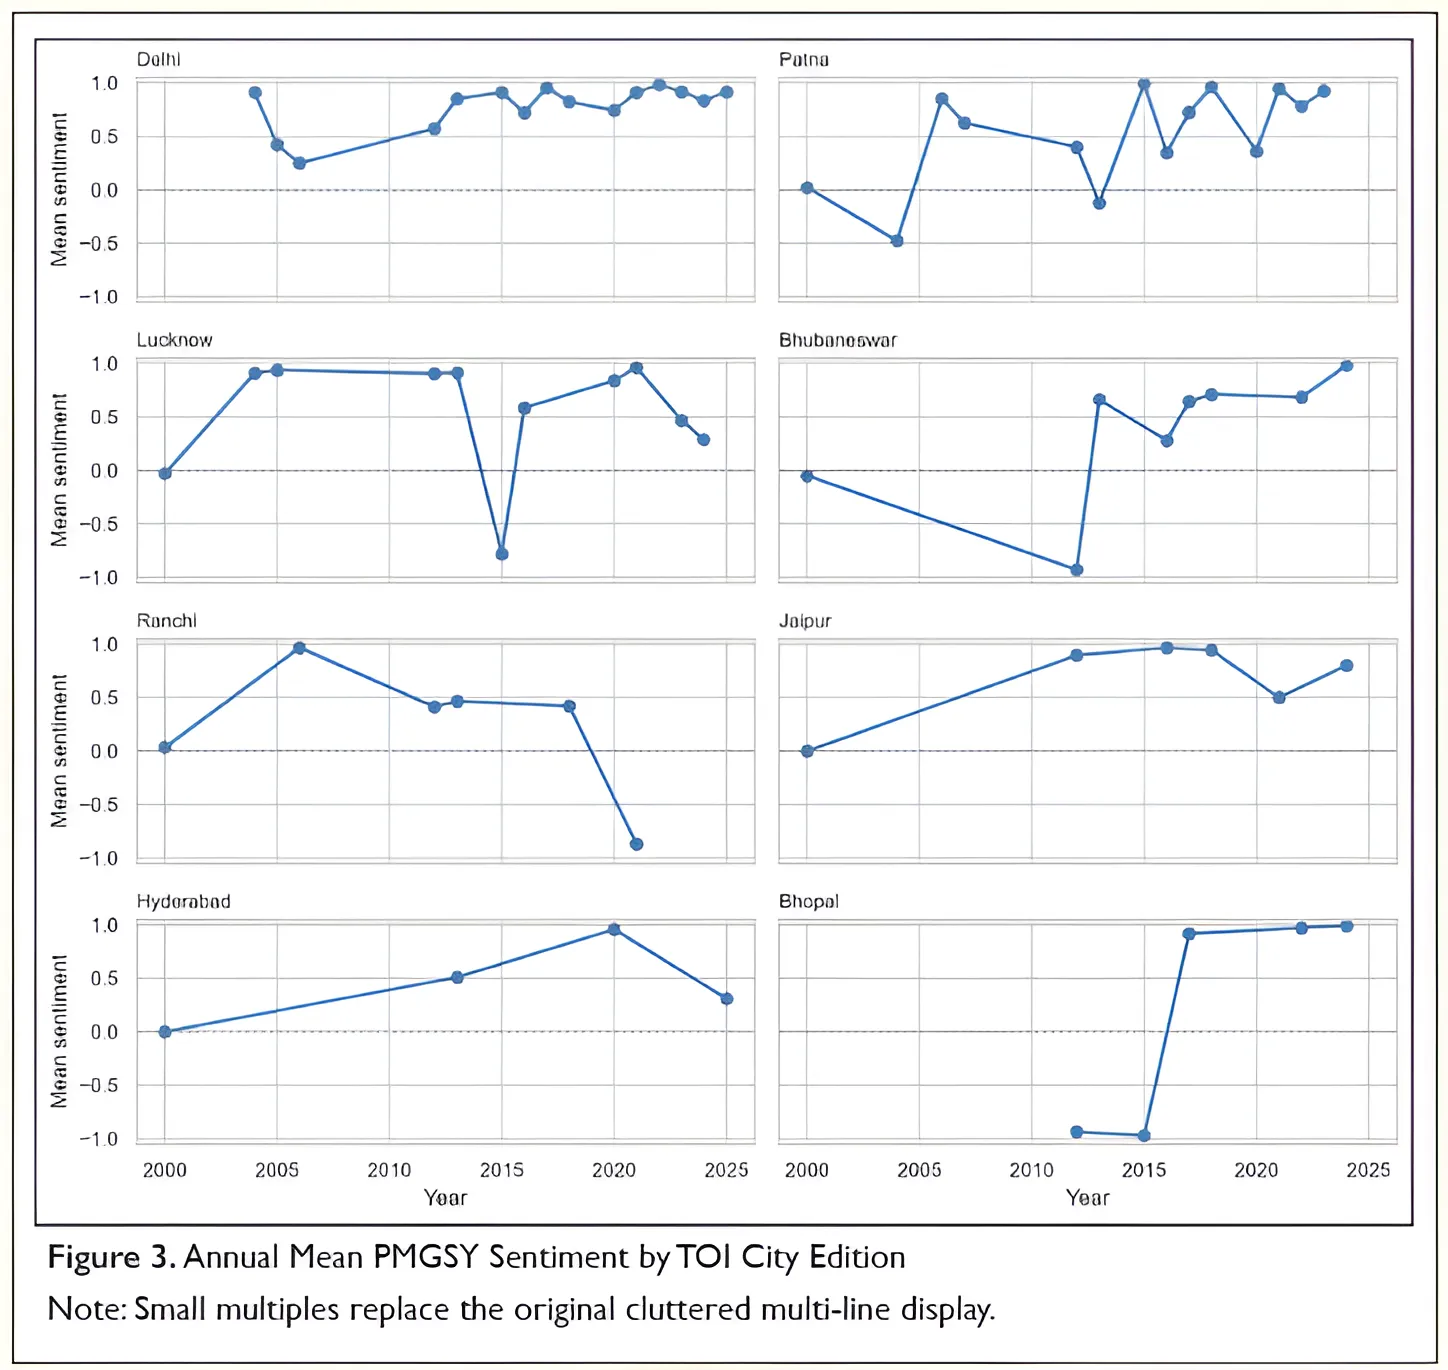
, nˉ=83nˉ=83 ), followed by Karnataka- linked Bangalore coverage (0.640,nˉ=3)(0.640,nˉ=3) , Rajasthan (0.443,nˉ=14)(0.443,nˉ=14) and Uttar Pradesh (0.387,nˉ=48)(0.387,nˉ=48) . These rankings reconcile the earlier inconsistency between the text and choropleth: Delhi is the clearest high- sentiment case, while Karnataka is high but based on very few articles and therefore should not be overinterpreted. The revised figures label the y- axis as the VADER compound sentiment score rather than the internal variable name. The TOI time- series display is also revised as annual small multiples to reduce visual clutter and make edition- specific patterns easier to compare (Figure 3).
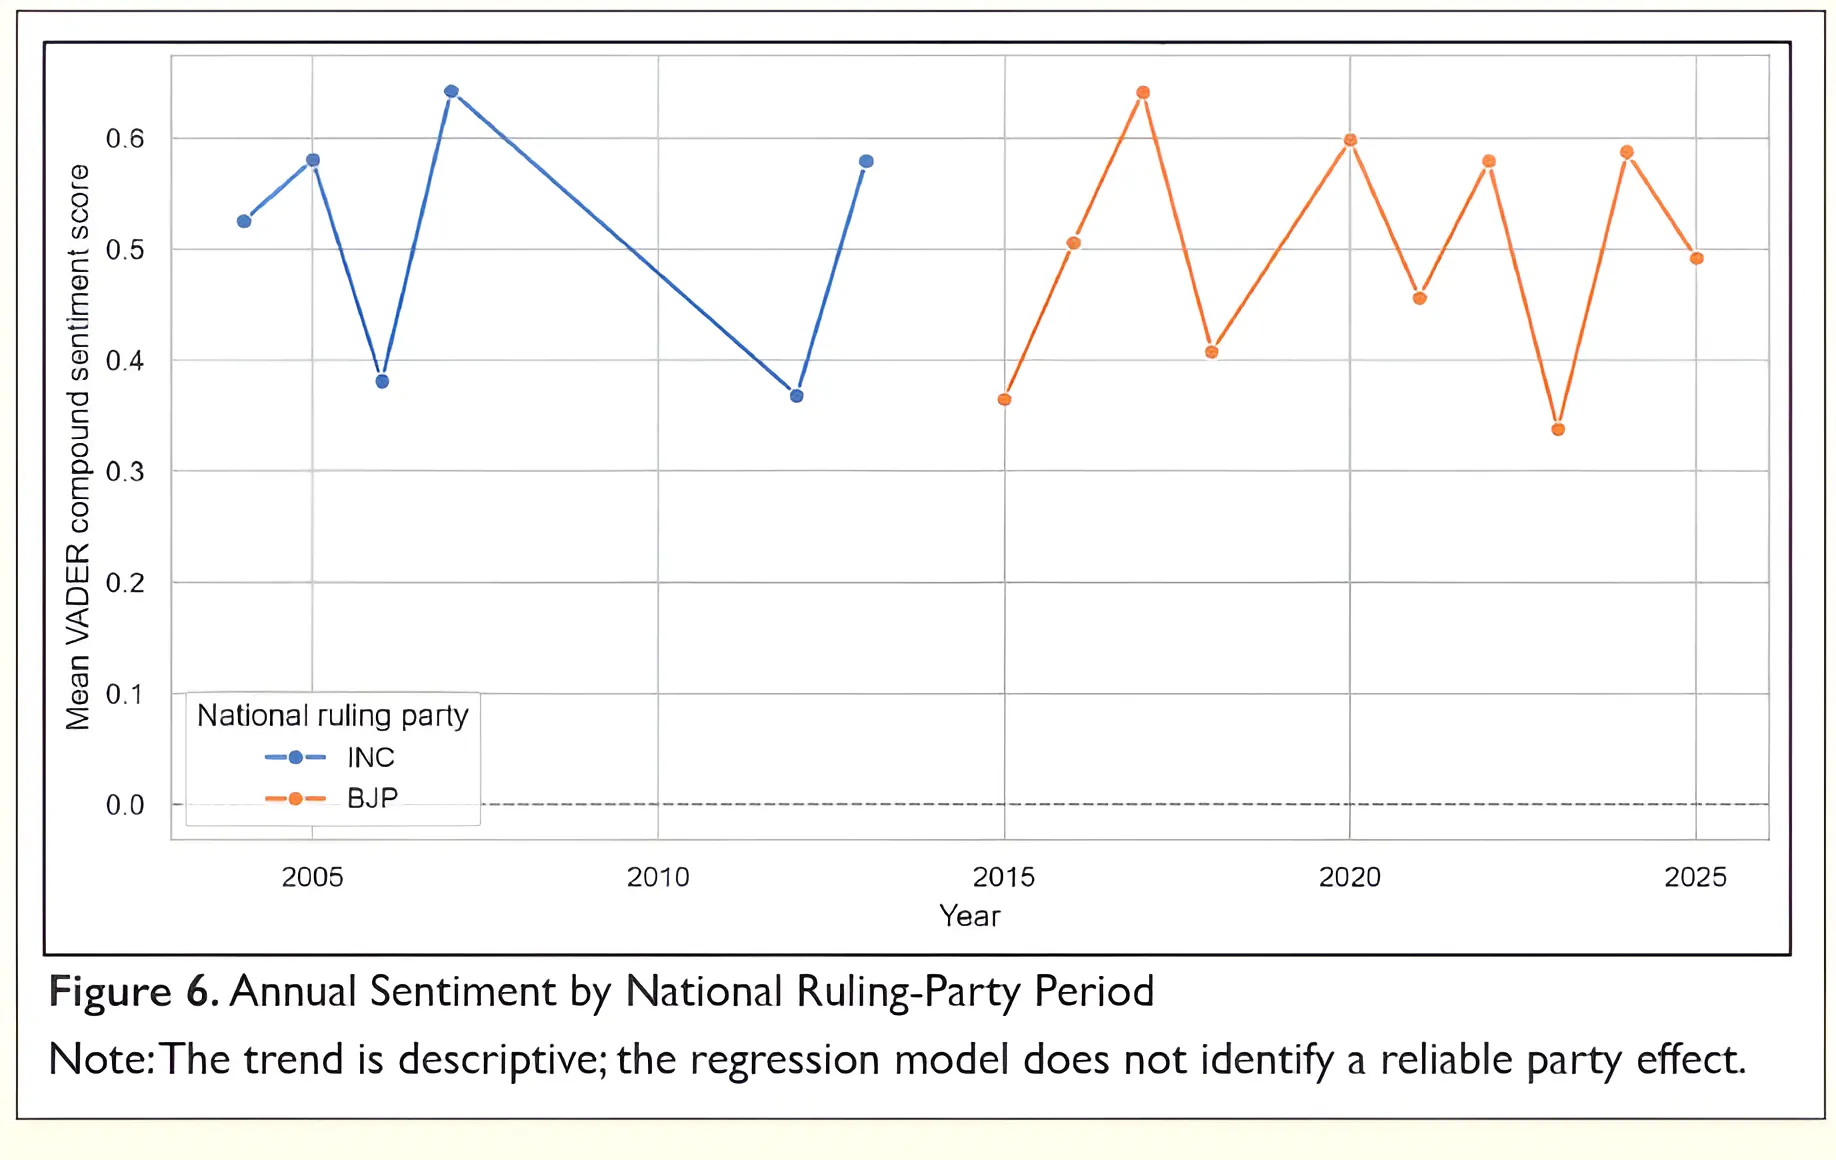
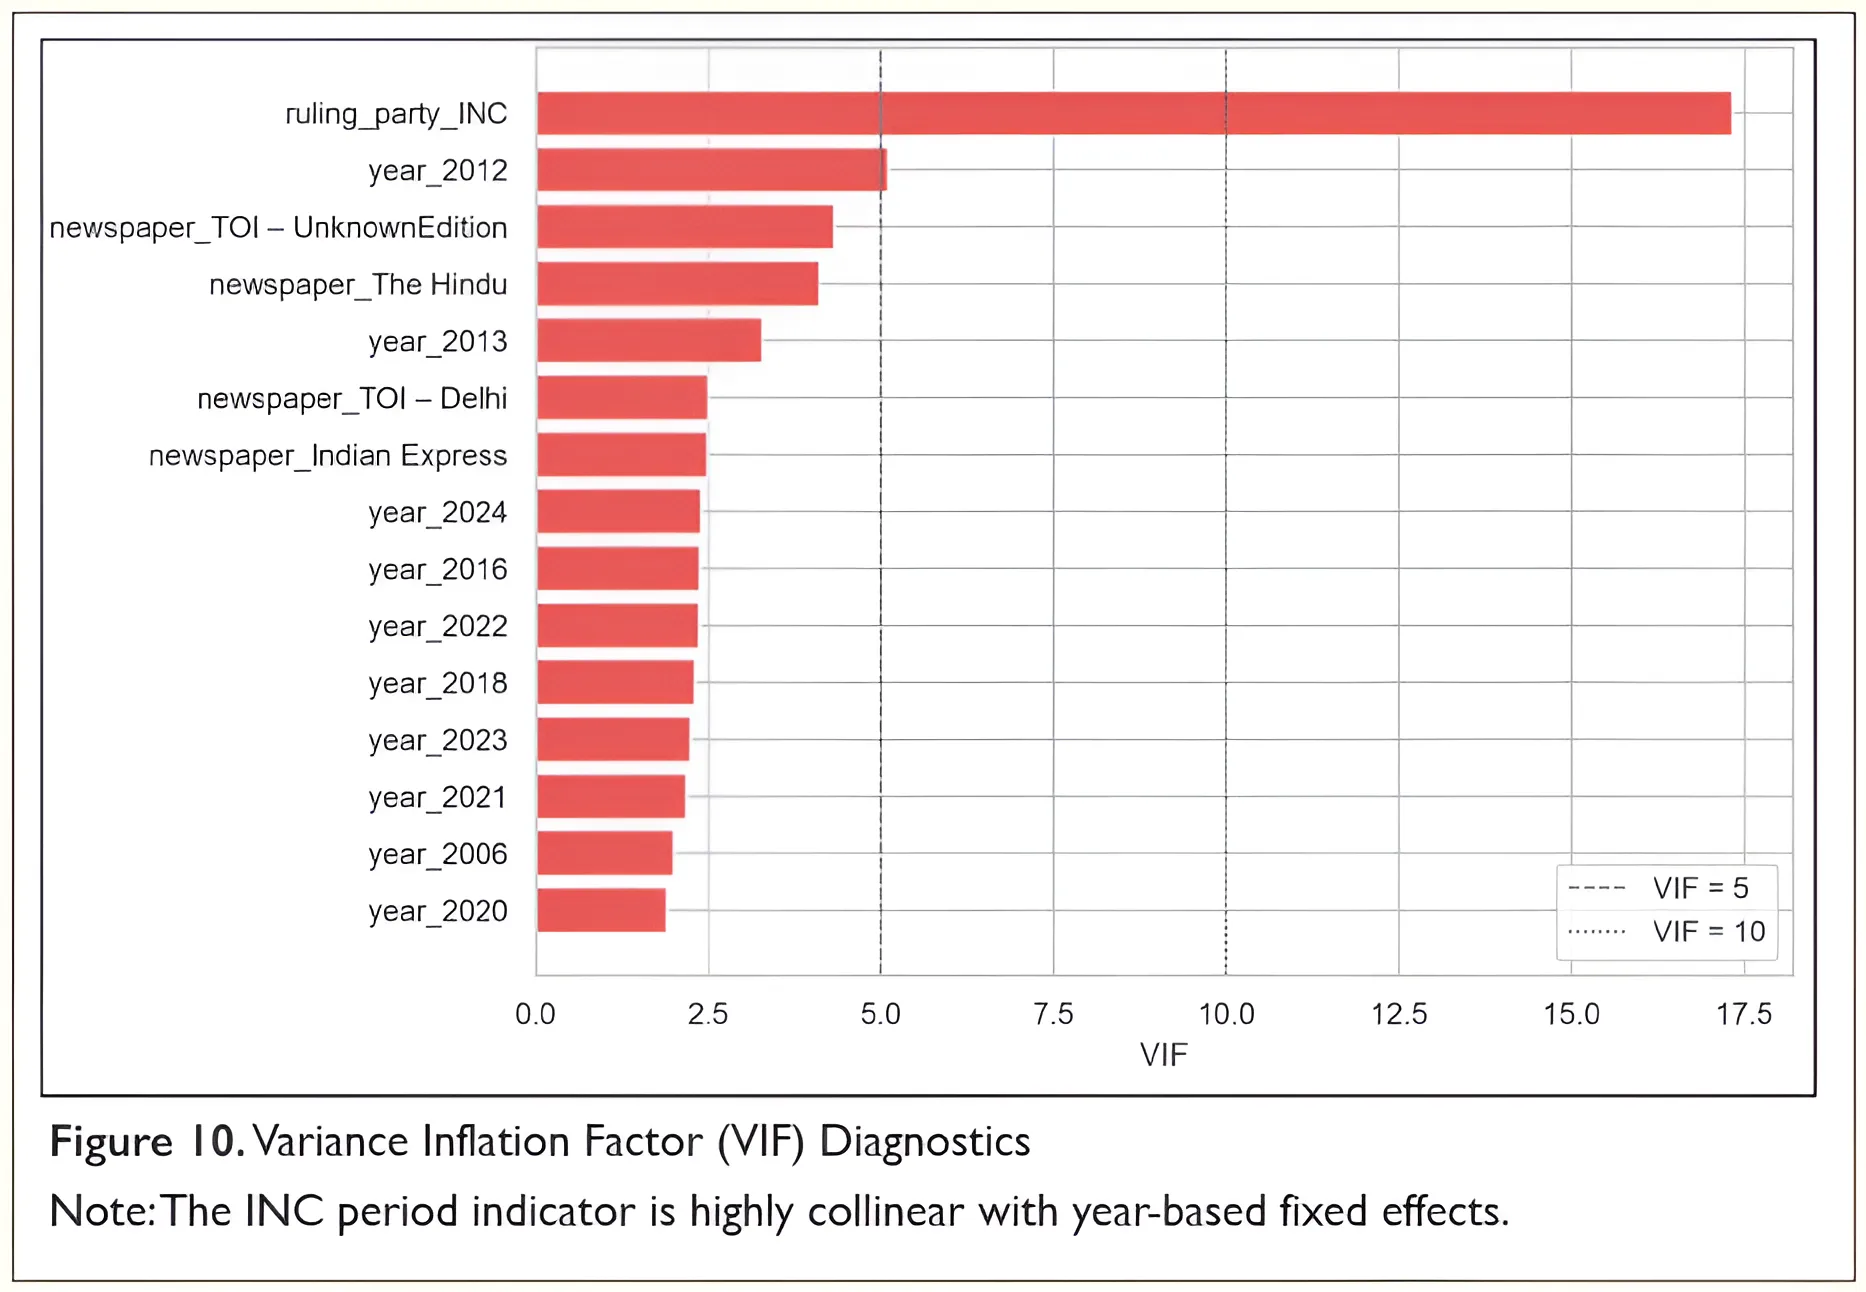
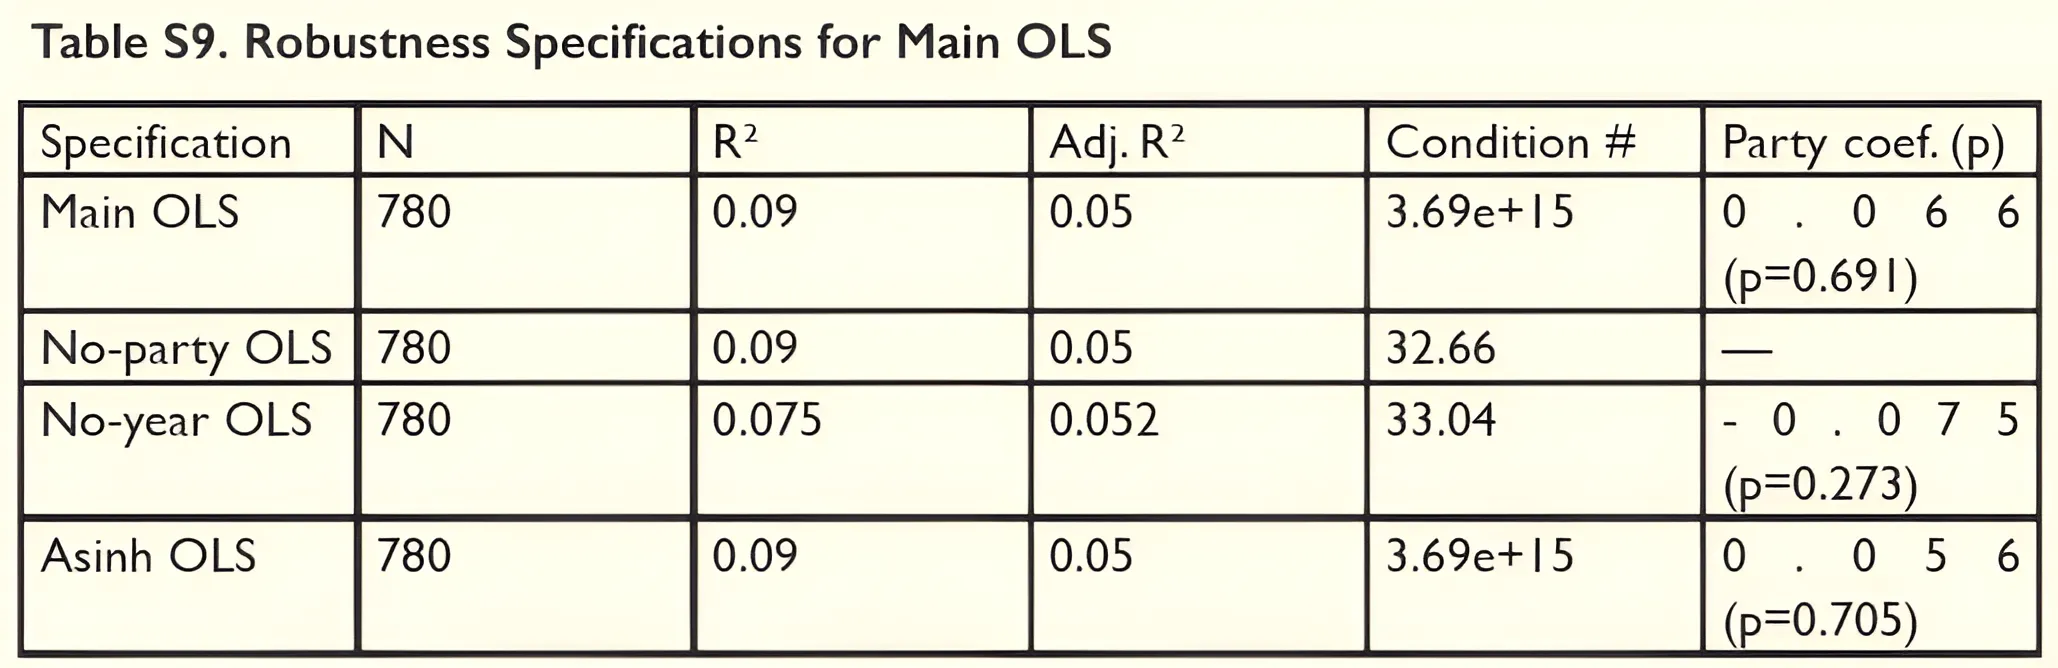
Turning to party- period patterns, descriptive statistics show that sentiment remains positive under both INC and BJP national governments (Figure 6). The main OLS regression, estimated with cluster- robust standard errors by newspaper, has N=780N=780 , R2=0.090R2=0.090 , and adjusted R2=0.050R2=0.050 . The coefficient for INC rule relative to BJP rule is positive but not statistically significant (coefficient =0.066=0.066 , p=0.691p=0.691 ). These results do not support a strong partisan interpretation. The low explanatory power is also not presented as evidence that outlet and temporal factors dominate sentiment; instead, it suggests that much of the article- level variation likely lies in unobserved characteristics such as topic, journalist identity, geographic specificity, local implementation context, or whether a story emphasizes benefits, delays, corruption, funding, or human- interest narratives. Diagnostics reinforce this caution. The fully saturated model has a very high condition number because ruling- party period is highly collinear with year fixed effects. The VIF diagnostics identify the INC period indicator as the largest source of collinearity (VIF =17.34=17.34 ), while no- party and no- year robustness specifications are much better conditioned. Thus, the political- period results are best understood as descriptive evidence against a large partisan shift, not as definitive proof that party context is irrelevant.
Geography adds further nuance to PMGSY coverage, but the spatial findings are modest. The revised state sentiment figure identifies Delhi, Karnataka, Rajasthan, and Uttar Pradesh as the highest observed state- linked averages, with explicit small- n caution for Karnataka and Gujarat (Figure 7). Moran's I is positive (0.112 across 11 shapefile- matched states), suggesting weak spatial similarity in neighboring state sentiment, but the finding is substantively limited. The state sentiment table contains 12 states; Telangana is excluded from Moran's I because it does not match the state- boundary shapefile used to construct spatial weights. The spatial weights matrix is sparse because the corpus maps only a limited set of TOI city editions to states, and the analysis does not include regional- language coverage that would better represent rural audiences.
The difference- in- differences analysis around the March 2015 reform date also counsels caution (Figures 8 and 9). The treatment group is defined as mapped TOI state editions located in BIP- governed states at the reform date, with other mapped states serving as controls. In the primary state- fixed- effects model, the post- reform coefficient is positive, but the post- by- treatment interaction is near zero and not statistically significant (coefficient =0.008=0.008 , p=0.977p=0.977 ; N=289N=289 ). The model's condition number is 19.94 after dropping the collinear standalone treatment term. The newspaper fixed- effects sensitivity specification applies the same logic because city editions map to states and therefore also absorb the state- level treatment indicator. The event- study check is estimated on state- year collapsed data because sparse cells make a saturated state- fixed- effects event study unreliable at this sample size. After filtering sparse relative years, the event- study model is well- conditioned (condition number =6.41=6.41 ), and no pre- treatment interaction is statistically significant at p<0.05p<0.05 . Nevertheless, the limited number of treated observations means that the DiD should be interpreted as a descriptive reform- period comparison rather than as strong causal evidence of partisan influence.
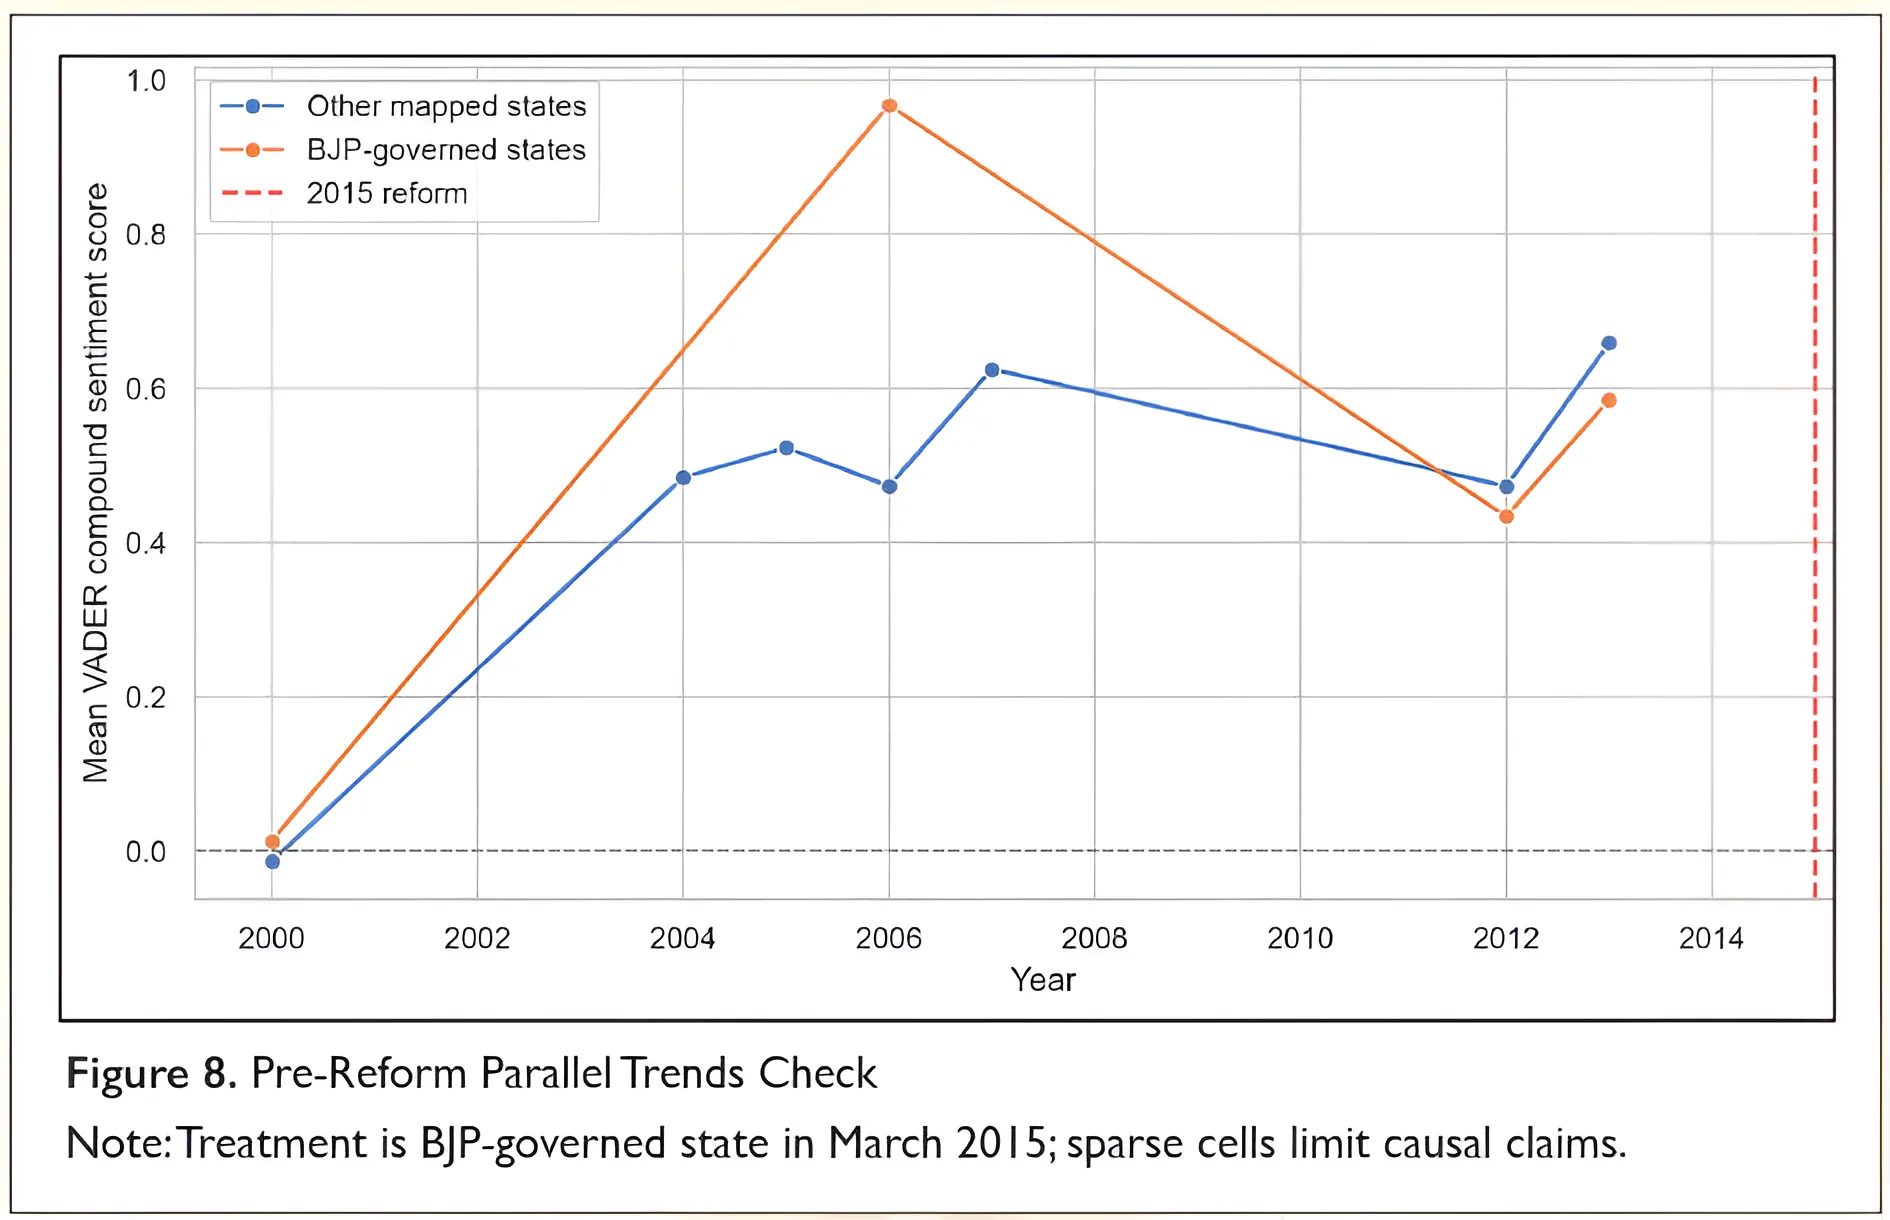
The substantive implication of the DiD results is therefore modest but still useful. The absence of a significant post- by- treatment interaction suggests that the 2015 reform period did not produce a clear differential shift in English- language PMGSY sentiment for BJP- governed states relative to the available controls. This does not mean that party politics played no role in program publicity, credit- claiming, or implementation. Rather, it means that the available English- language newspaper corpus does not provide strong evidence of a differential sentiment shift at the state- edition level. That distinction is important because it narrows the claim from 'partisanship does not matter' to the more defensible conclusion that broad sentiment in this corpus is not well explained by the party- period variables tested here.
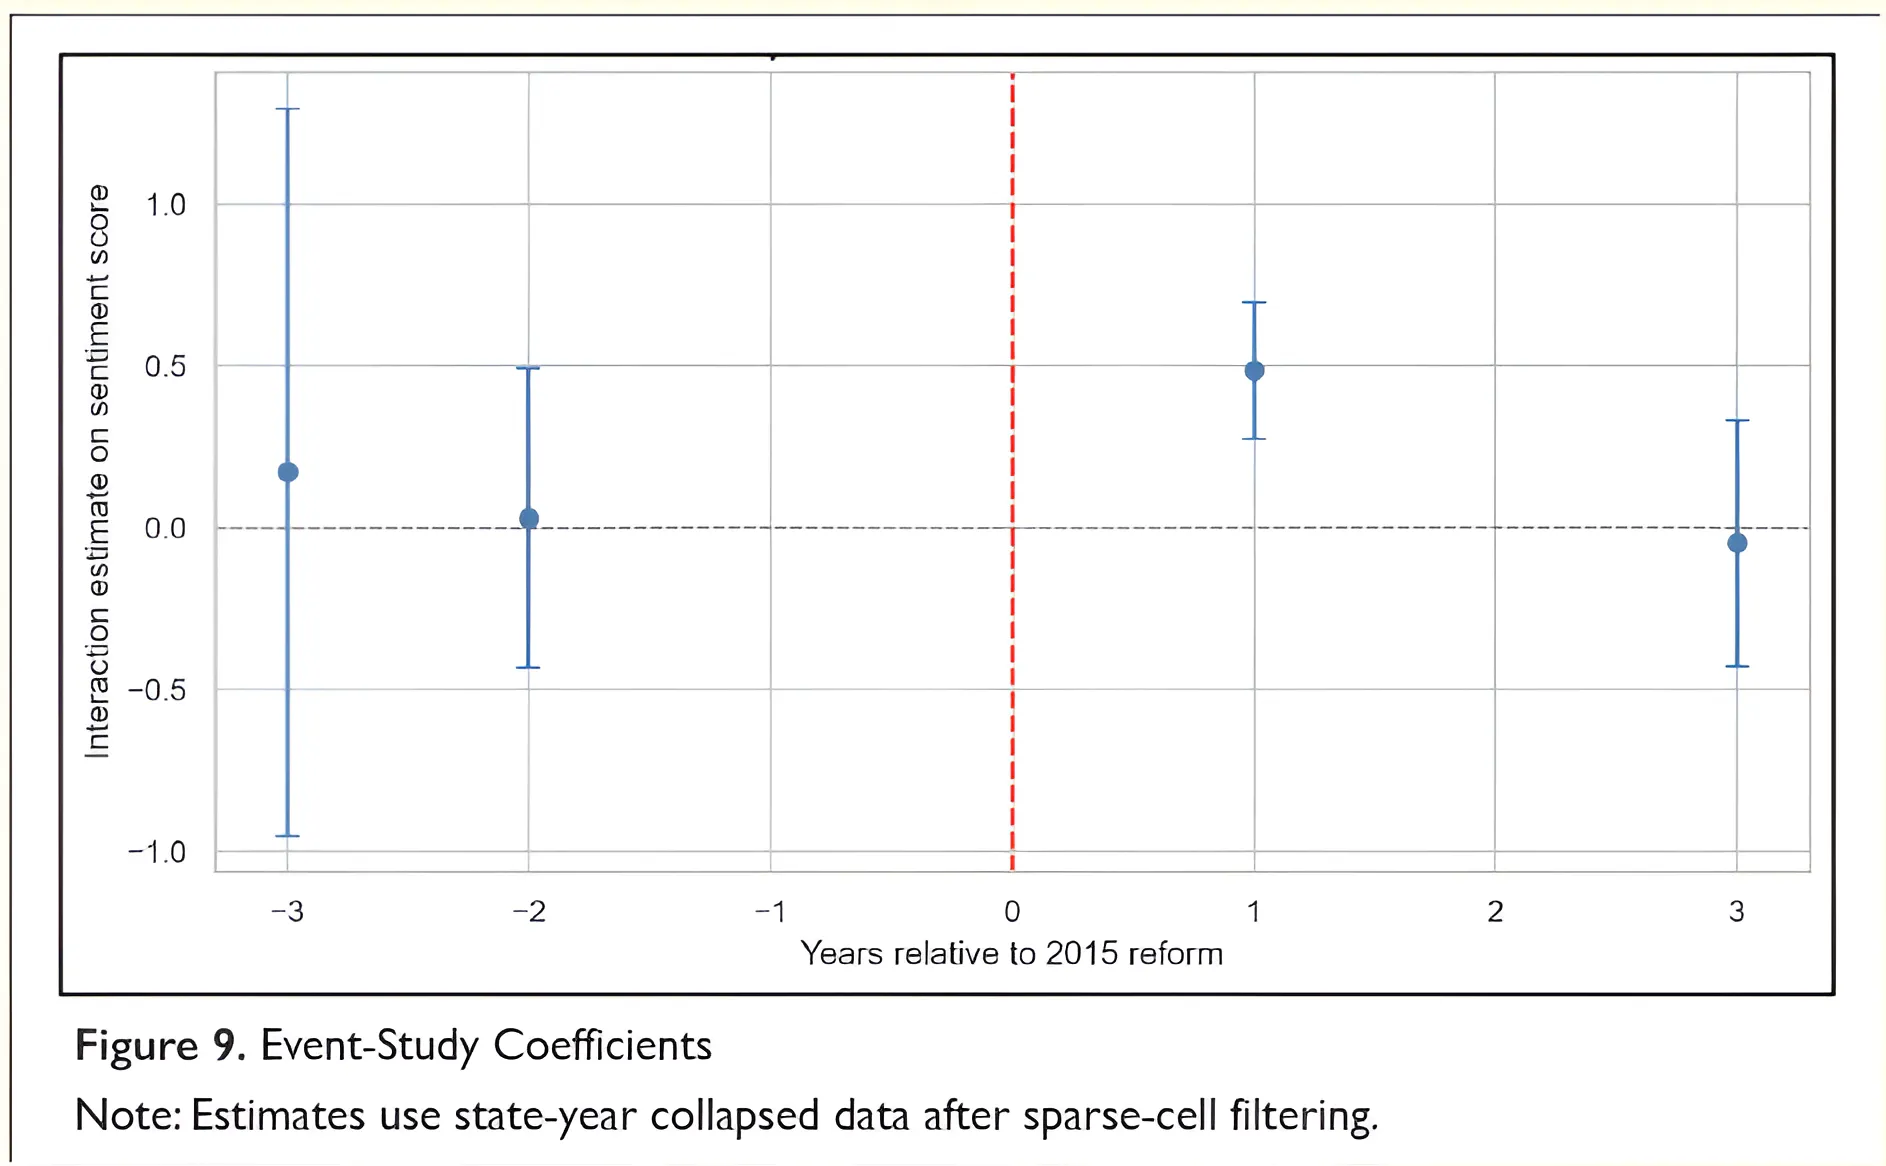
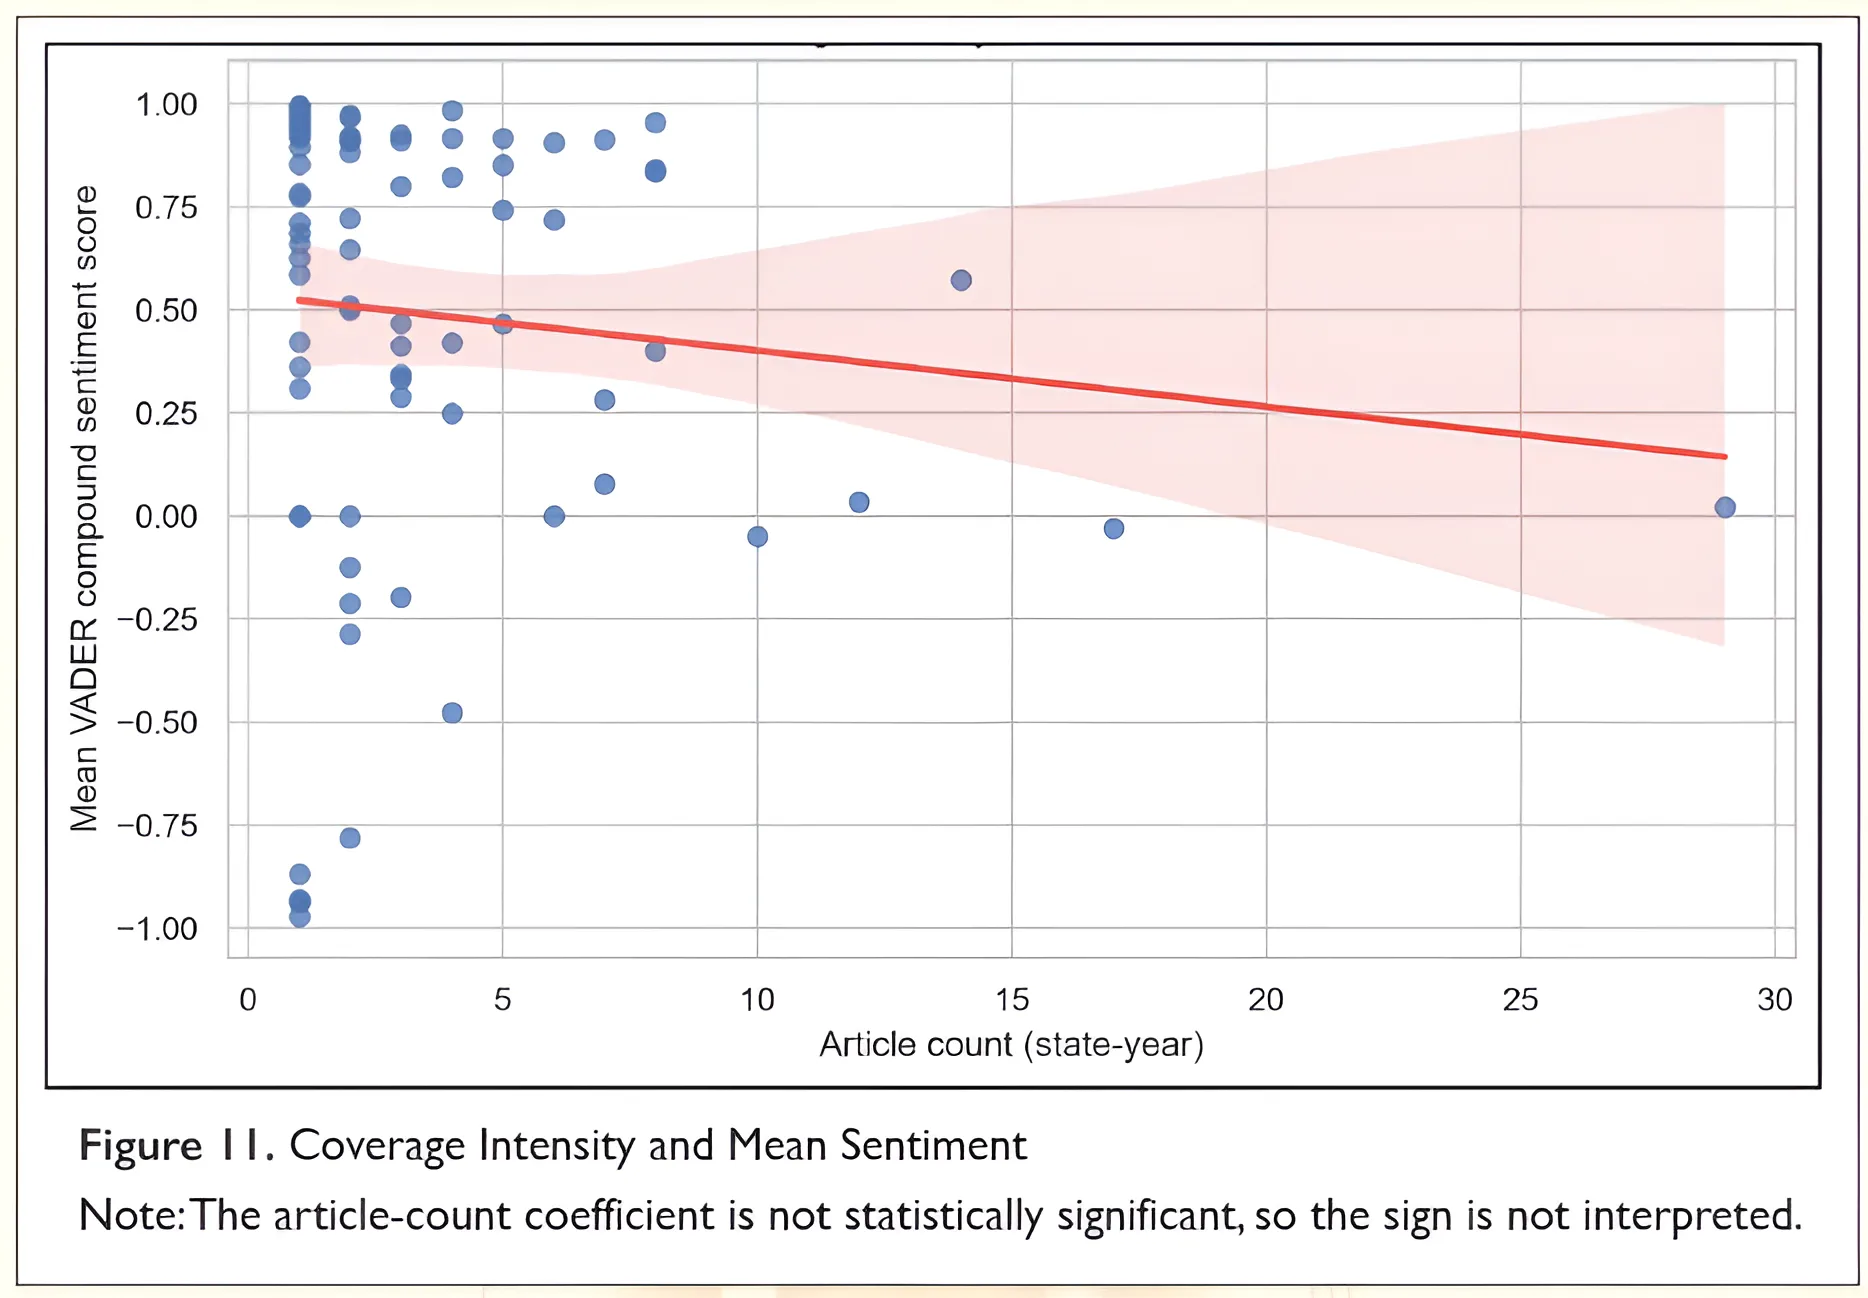
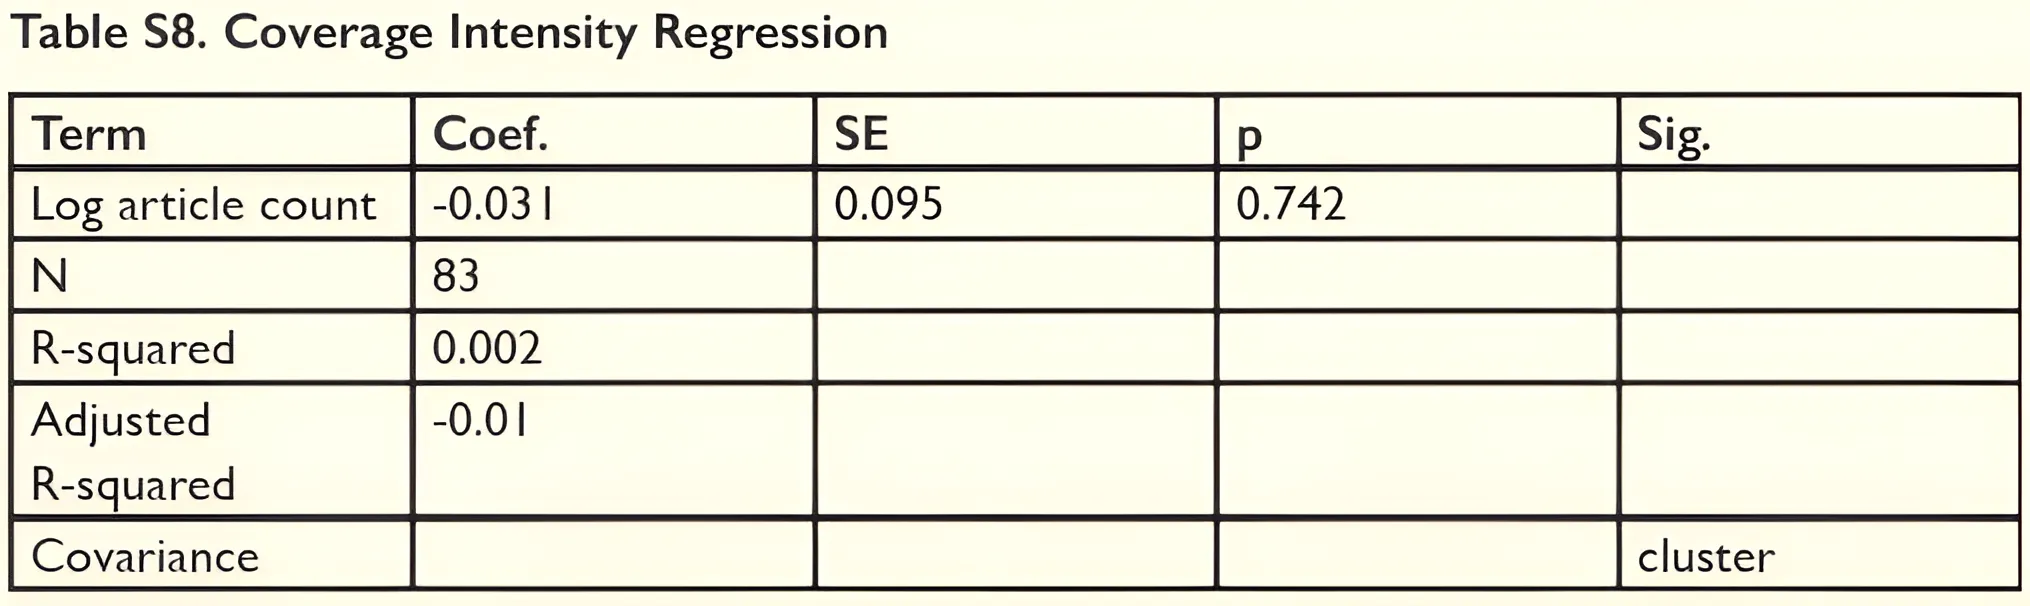
Figure 7 shows why Karnataka should not be described as a major high- sentiment case without mentioning its small article count. The revised exhibits are designed to make those constraints visible. Figures 8 and 9 show that the DiD design has limited support in some relative years. These visual changes are not cosmetic; they align the empirical presentation with the scope of the data. Figure 10 shows why the fully saturated ruling- party model must be interpreted cautiously. A reviewer should now be able to see not only the substantive patterns, but also the diagnostic evidence that qualifies those patterns. The coverage- intensity analysis also offers no support for a volume- drivestone interpretation (Figure 11). A regression of state- year mean sentiment on log article count is statistically insignificant (p=0.742,R2=0.002)(p=0.742,R2=0.002) , so the negative coefficient carries no substantive interpretive weight. In short, neither geography nor article volume overturns the broader finding of generally positive but heterogeneous English- language coverage.
At the same time, the absence of strong partisan effects should not be mistaken for the absence of politics in infrastructure communication. PMGSY is a centrally sponsored pro- gram implemented through state and local institutions, so political incentives may operate through funding announcements, project selection, ribbon- cutting events, and local credit- claiming rather than through a simple shift in article sentiment after one national reform date. The present data are better suited to detecting broad tonal patterns than to identifying those micro- level mechanisms. For this reason, the revised discussion treats partisanship as one possible source of framing variation but not as the only one or even the dominant one.
Discussion
This is the first analysis to demonstrate that the English-language print coverage of PMGSY has generally been favorable, but the revised evidence supports a more cautious interpretation. Positive sentiment is visible across outlets, city editions, and time, yet the regression models explain only a modest share of article-level variation and do not show a robust partisan effect. This suggests that PMGSY was often framed as a development and implementation story rather than as a straightforward party-political story. That finding is substantively important because it shows how large infrastructure programs can receive favorable elite-media coverage even when their delivery depends on complex intergovernmental coordination. At the same time, the models indicate that article-level content—such as whether a story emphasizes beneficiaries, delays, corruption, funding, road access, or local economic outcomes—likely matters more than the broad political variables available in this dataset. The broader implication is not that infrastructure coverage is apolitical, but that party labels alone do not explain how PMGSY is narrated in English-language print media.
This study has several limitations that should be foregrounded. First, the exclusive focus on English-language print media omits vernacular newspapers, regional-language television, radio, and digital platforms that reach much larger shares of rural India. Because PMGSY’s beneficiaries are overwhelmingly rural and often Hindi- or regional-language-speaking, the positive sentiment identified here may reflect elite urban media framing rather than broader public sentiment. Second, the final analyzed corpus contains 968 outlet-attributed articles, not the larger raw search-hit figure sometimes reported by Factiva exports. This distinction matters because search hits, downloads, PDF extraction, deduplication, and outlet attribution all reduce the analyzable corpus. Third, VADER is transparent and replicable but cannot fully capture sarcasm, regional idioms, or issue-specific frames in Indian media. Fourth, the regression models are descriptive and limited by omitted articlelevel predictors. Fifth, the DiD and event-study analyses are constrained by sparse state-year cells and should be treated as diagnostic reform-period comparisons rather than strong causal estimates.
Future research should extend the corpus to regional- language and digital outlets, incorporate topic modeling or supervised frame classification, and link media framing to implementation data such as road completion, maintenance, budget releases, or local economic outcomes. As India continues to invest in large- scale rural development, these extensions would help explain not only whether infrastructure is covered positively, but which stories, communities, and political actors shape that coverage.
Future research should extend the corpus to regional- language and digital outlets, incorporate topic modeling or supervised frame classification, and link media framing to implementation data such as road completion, maintenance, budget releases, or local economic outcomes. As India continues to invest in large- scale rural development, these extensions would help explain not only whether infrastructure is covered positively, but which stories, communities, and political actors shape that coverage.
These limitations also point to a broader theoretical implication. Infrastructure programs such as PMGSY are often evaluated through kilometers built, villages connected, budgets allocated, or economic outcomes produced. Media framing adds a different layer: it shows how policy achievements are translated into narratives of development, access, political competence, or administrative failure. A favorable English- language press environment may help normalize a flagship program as a nonpartisan development success, but it may also obscure local grievances, maintenance failures, or regional inequalities that are more visible in vernacular media. The value of this study is therefore not that it provides a final measure of public approval, but that it documents one influential media layer in the politics of interpreting rural infrastructure.
Future work should build a more multilingual and content- rich corpus. A stronger next- stage design would collect Hindi, regional- language, and digital coverage; classify articles by topic or frame; and link sentiment to district- level project outcomes such as completion dates, cost overruns, road quality, or maintenance records. Such a design would allow researchers to distinguish positivity driven by beneficiary stories from positivity driven by government announcements, and to test whether negative coverage clusters around delays, corruption allegations, or regions with weaker implementation. It would also make the causal claims more credible by moving beyond broad party- period indicators toward more precise article- level and project- level mechanisms.
Supplementary Materials: The following supplementary tables are available: Table S1. Corpus Attrition; Table S2. Per- PDF Extraction Results; Table S3. Main OLS Regression Summary; Table S4. Top VIF Diagnostics; Table S5. Difference- in- Differences Regression; Table S6. Event- Study Diagnostics; Table S7. State Sentiment Summary; Table S8. Coverage Intensity Regression; and Table S9. Robustness Specifications for Main OLS.
Author Contributions: Conceptualization, A.B.; methodology, A.B.; software, A.B.; validation, A.B.; formal analysis, A.B.; investigation, A.B.; resources, A.B.; data curation, A.B.; writing—original draft preparation, A.B.; writing—review and editing, A.B.; visualization, A.B.; project administration, A.B. The author has read and agreed to the published version of the manuscript.
Funding: This research received no external funding. The APC was not externally funded.
Institutional Review Board Statement: Not applicable. This study analyzes publicly available newspaper text and does not involve human participants or animals.
Informed Consent Statement: Not applicable. This study does not involve human participants.
Data Availability Statement: The article- level data were derived from Factiva export files and are subject to database access restrictions. Derived aggregate tables and figures supporting the reported results are included in the manuscript and supplementary tables.
Acknowledgments: The author thanks Dr. Holli Semetko for her continued support, and thanks the reviewers and Review Editor for constructive comments that improved the manuscript.
Conflicts of Interest: The author declares no conflicts of interest. There were no funders involved in the design of the study; in the collection, analyses, or interpretation of data; in the writing of the manuscript; or in the decision to publish the results.
-
Aggarwal, Shilpa. "Do Rural Roads Create Pathways out of Poverty? Evidence from India." Journal of Development Economics, vol. 133, July 2018, pp. 375-395, https://doi.org/10.1016/j. jdeveco.2018.01.004.2. Anselin, Luc. "Local Indicators of Spatial Association-LISA." Geographical Analysis, vol. 27, no. 2, 3 Sept. 1995, pp. 93-115, https://doi.org/10.1111/j.1538-4632.1995. tb00338. x.3. Asher, Sam, and Paulina Novosad. 2020. "Rural Roads and Local Economic Development." American Economic Review 110 (3): 797-823.4. Balahur, Alexandra, et al. "Sentiment Analysis in the News." ArXiv (Cornell University), 1 Jan. 2013, https://doi.org/10.48550/arxiv.1309.6202.5. Bell, Clive, and Susanne van Dillen. "On the Way to Good Health? Rural Roads and Morbidity in Upland Orissa." Journal of Transport & Health, vol. 10, Sept. 2018, pp. 369-380, https://doi.org/10.1016/j.jth.2018.06.010. Accessed 21 Sept. 2021.6. Binswanger, Hans P., Shahidur R. Khandker, and Mark Rosenzweig. 1993. "How Infrastructure and Financial Institutions Affect Agricultural Output and Investment in India." Journal of Development Economics 41 (2): 337-366.7. Bird, S., Klein, E., & Loper, E. (2009). Natural Language Processing with Python. O'Reilly Media. https://www.nltk.org/8. Chong, Dennis, and James N. Druckman. "Framing Theory." Annual Review of Political Science, vol. 10, no. 1, June 2007, pp. 103-126, https://doi.org/10.1146/annurev.polisc.10.072805.103054.9. Datta, Shoumi. 2012. "The Impact of Improved Highways on Indian Firms." Journal of Development Economics 99 (1): 46-57.10. Entman, Robert M. 1993. "Framing: Toward Clarification of a Fractured Paradigm." Journal of Communication 43 (4): 51-58.11. Government of India, Ministry of Rural Development. 2020. Basic Road Statistics of India 2019-20.12. Grimmer, Justin, and Brandon M. Stewart. "Text as Data: The Promise and Pitfalls of Automatic Content Analysis Methods for Political Texts." Political Analysis, vol. 21, no. 03, 2013, pp. 267-297.13. Hagberg, A. A., Schult, D. A., & Swart, P. J. (2008). Exploring Network Structure, Dynamics, and Function using NetworkX. Proceedings of the 7th Python in Science Conference, 11-15. https:// conference.scipy.org/proceedings/scipy2008/paper_2/14. Hutto, C. J., and Eric Gilbert. "VADER: A Parsimonious Rule- Based Model for Sentiment Analysis of Social Media Text." Proceedings of the International AAAI Conference on Web and Social Media, vol. 8, no. 1, 16 May 2014, pp. 216-225, https://doi.org/10.1609/icwsm.v8i1.14550.
-
Jordahl, K., den Bossche, J.V., Fleischmann, M., Huso, J., Richards, J., Roeschke, J., ... & Wasserman, J. (2020). geopandas/geopandas: v0.8.1. Zenodo. https://doi.org/10.5281/zenodo.3946761
-
Khandker, Shahidur R., et al. "The Poverty Impact of Rural Roads: Evidence from Bangladesh." Economic Development and Cultural Change, vol. 57, no. 4, July 2009, pp. 685-722, https://doi.org/10.1086/598765.
-
Lehne, Jonathan, et al. "Building Connections: Political Corruption and Road Construction in India." Journal of Development Economics, vol. 131, Mar. 2018, pp. 62-78, scholar.princeton.edu/sites/default/files/jns/files/lsve_2017_building_connections.pdf, https://doi.org/10.1016/j. jdeveco.2017.10.009.
-
McKinney, Wes. "Data Structures for Statistical Computing in Python." Proceedings of the 9th Python in Science Conference, vol. 445, 2010, https://doi.org/10.25080/majora-92bf1922-00a.
-
Neyazi, Taberez Ahmed. Political Communication and Mobilisation. Cambridge University Press, 10 Nov. 2017.
-
Pradhan Mantri Gram Sadak Yojana. 2020. Annual Progress Report.
-
Rey, Sergio J., and Luc Anselin. "PySAL: A Python Library of Spatial Analytical Methods." Review of Regional Studies, 10 Jan. 2007, https://doi.org/10.52324/001c.8285.
-
Seabold, Skipper, and Josef Perktold. "Statsmodels: Econometric and Statistical Modeling with Python." Proceedings of the 9th Python in Science Conference, 2010, https://doi.org/10.25080/ majora-92bf1922-011.
-
Semetko, Holli A., and Patti M. Valkenburg. "Framing European Politics: A Content Analysis of Press and Television News." Journal of Communication, vol. 50, no. 2, 1 June 2000, pp. 93-109, https://doi.org/10.1111/j.1460-2466.2000. tb02843. x.
-
Taboada, Maite, et al. "Lexicon-Based Methods for Sentiment Analysis." Computational Linguistics, vol. 37, no. 2, June 2011, pp. 267-307, dl.acm.org/citation.cfm?id=2000518, https://doi.org/10.1162/coli_a_00049.
-
Udupa, Sahana. Making News in Global India. Cambridge University Press, 31 May 2015. Accessed 14 Feb. 2025.
-
Wooldridge, Jeffrey M. Introductory Econometrics: A Modern Approach. 7th ed., Cengage Learning, 2020.
Supplementary Tables
Nine supplementary tables report corpus provenance, regression outputs, diagnostics, robustness checks, spatial summaries, and coverage- intensity results.
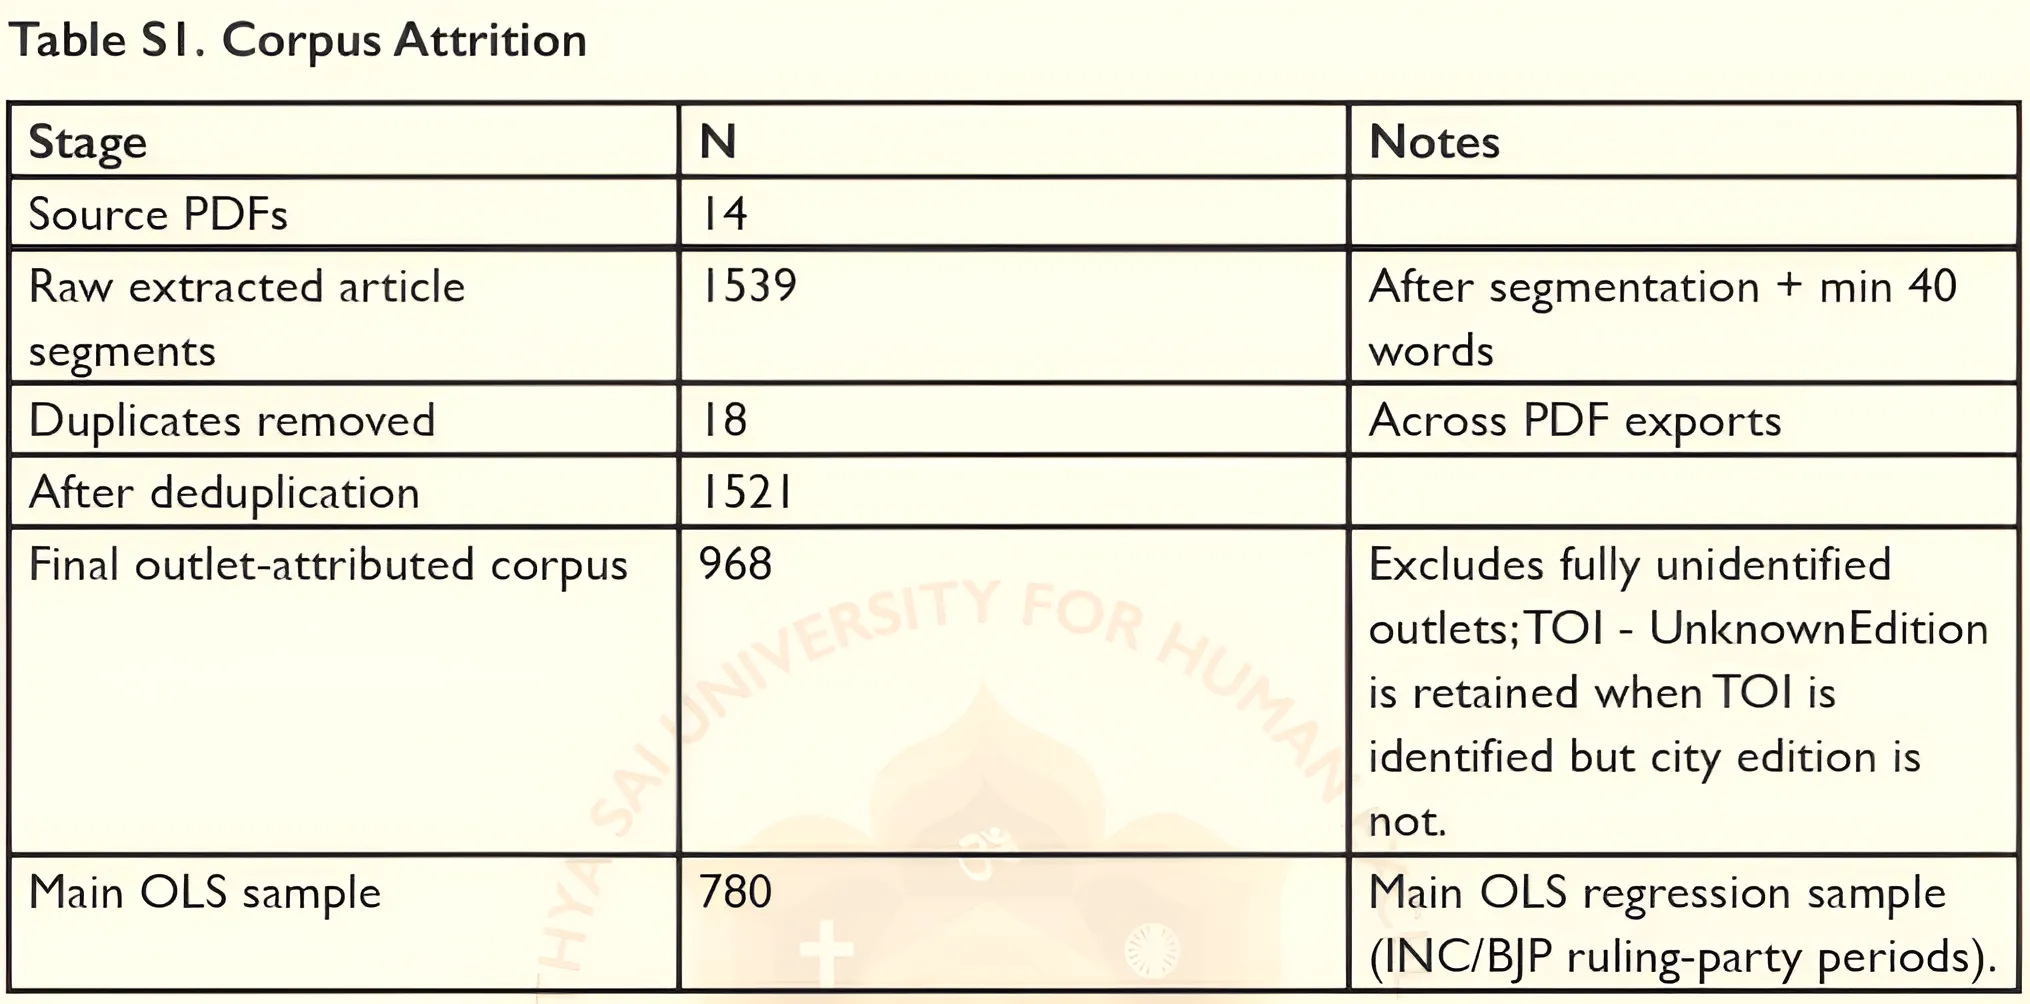
Note: Main OLS regression sample excludes articles without ruling- party period or required covariates. TOI - UnknownEdition is retained when TOI is identified but city edition is not.
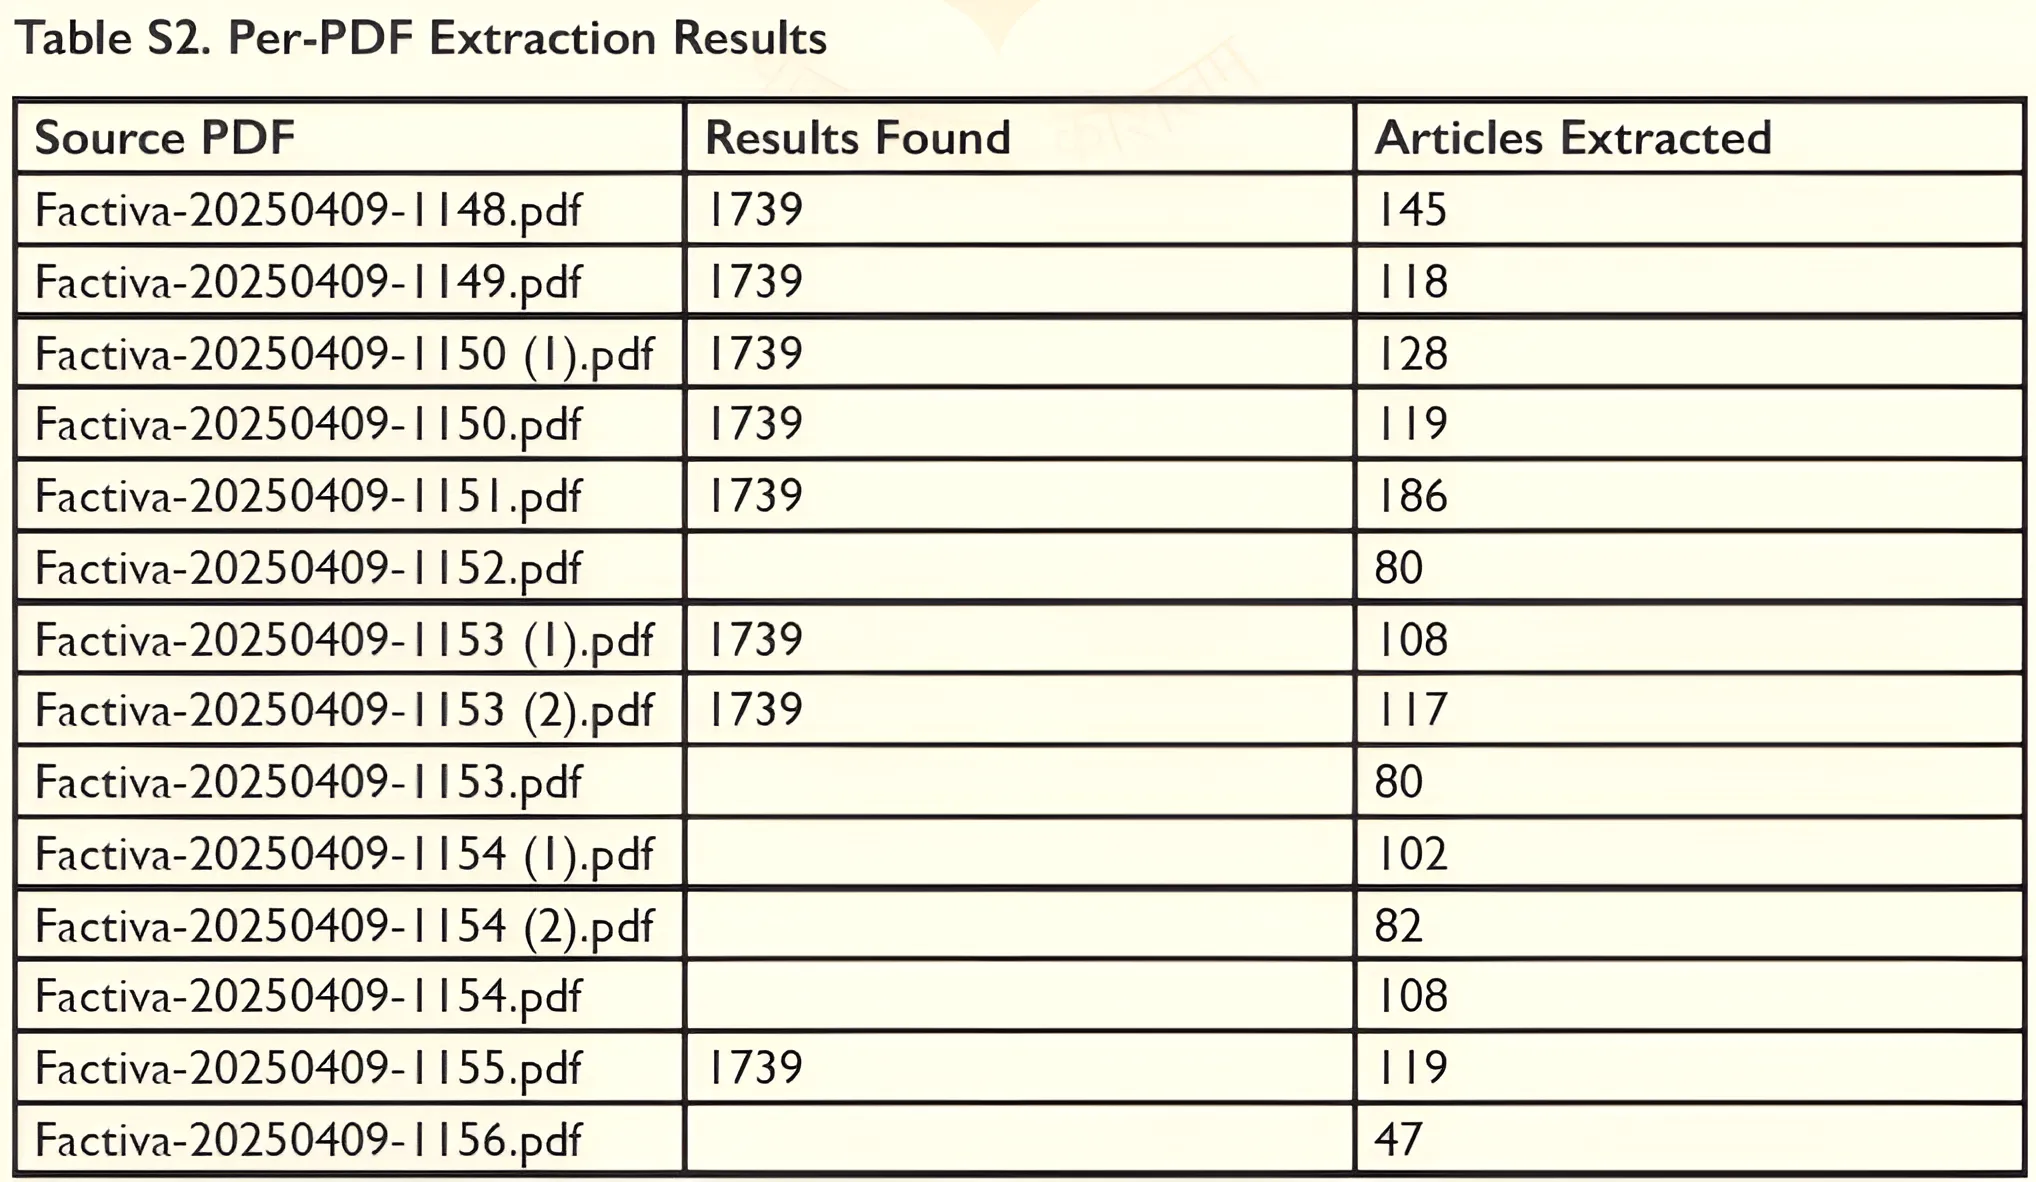
Note: Results Found is per- export metadata from the same underlying Factiva search/download sequence; blank cells indicate that the search- summary text was absent or not machine- readable in that export file.
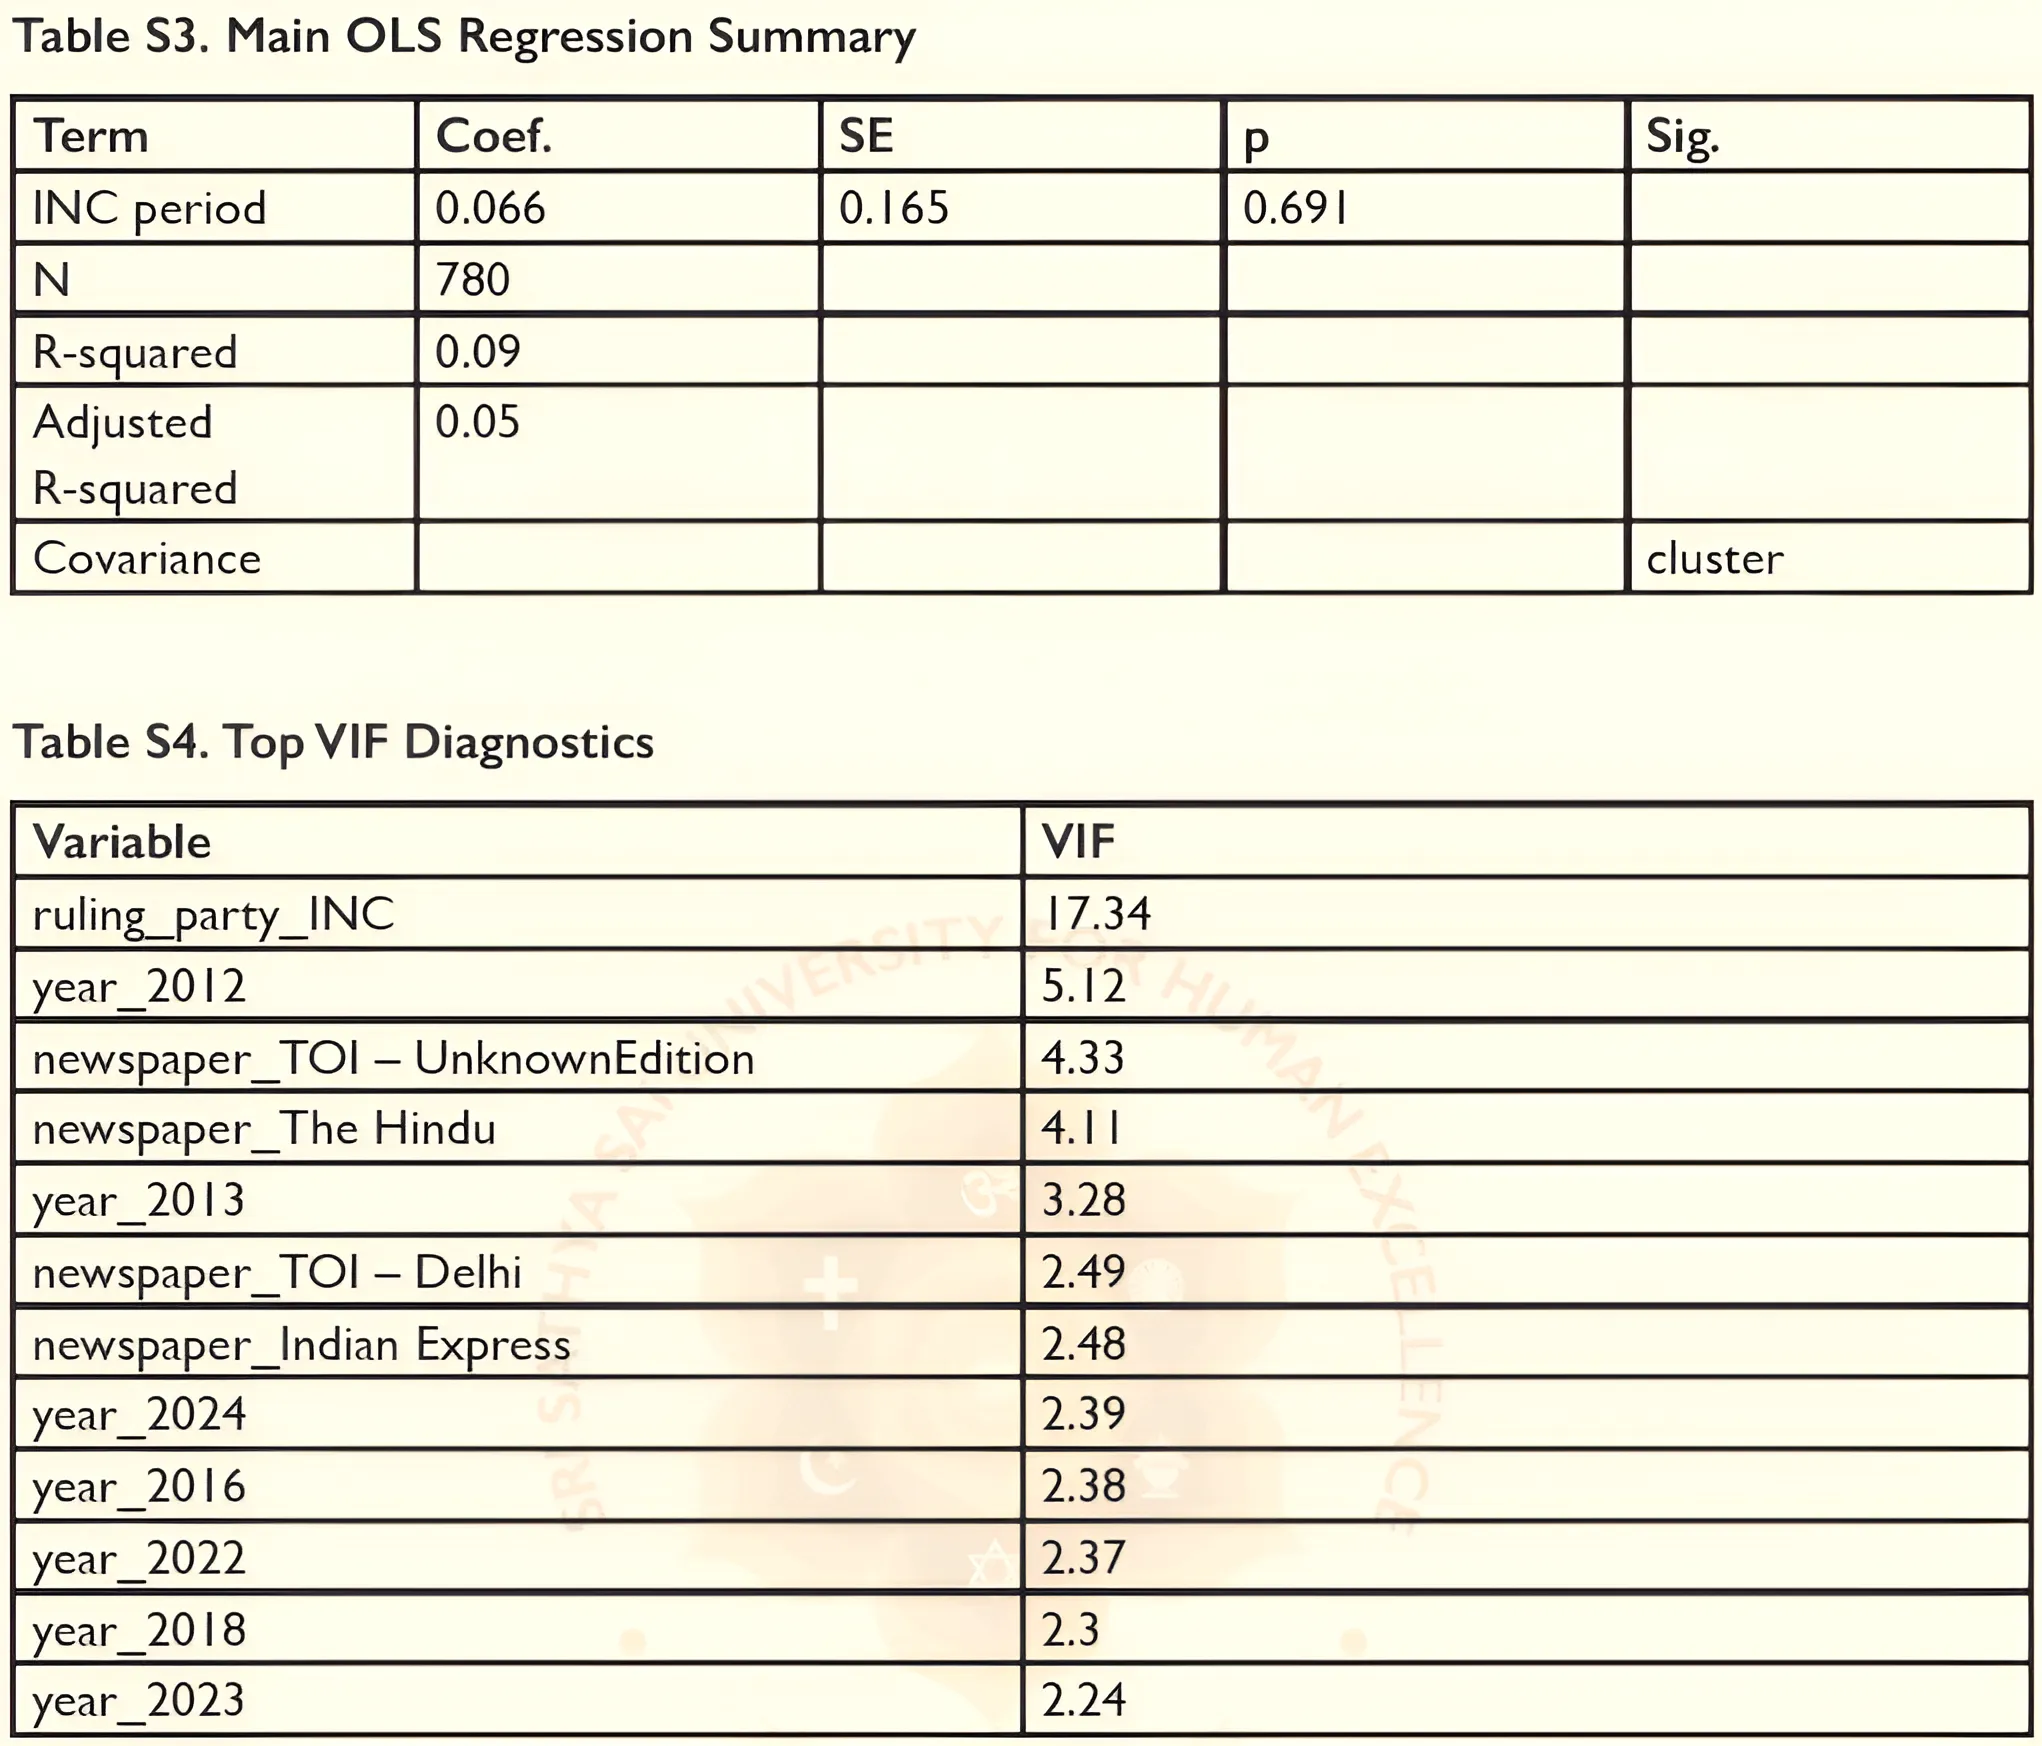
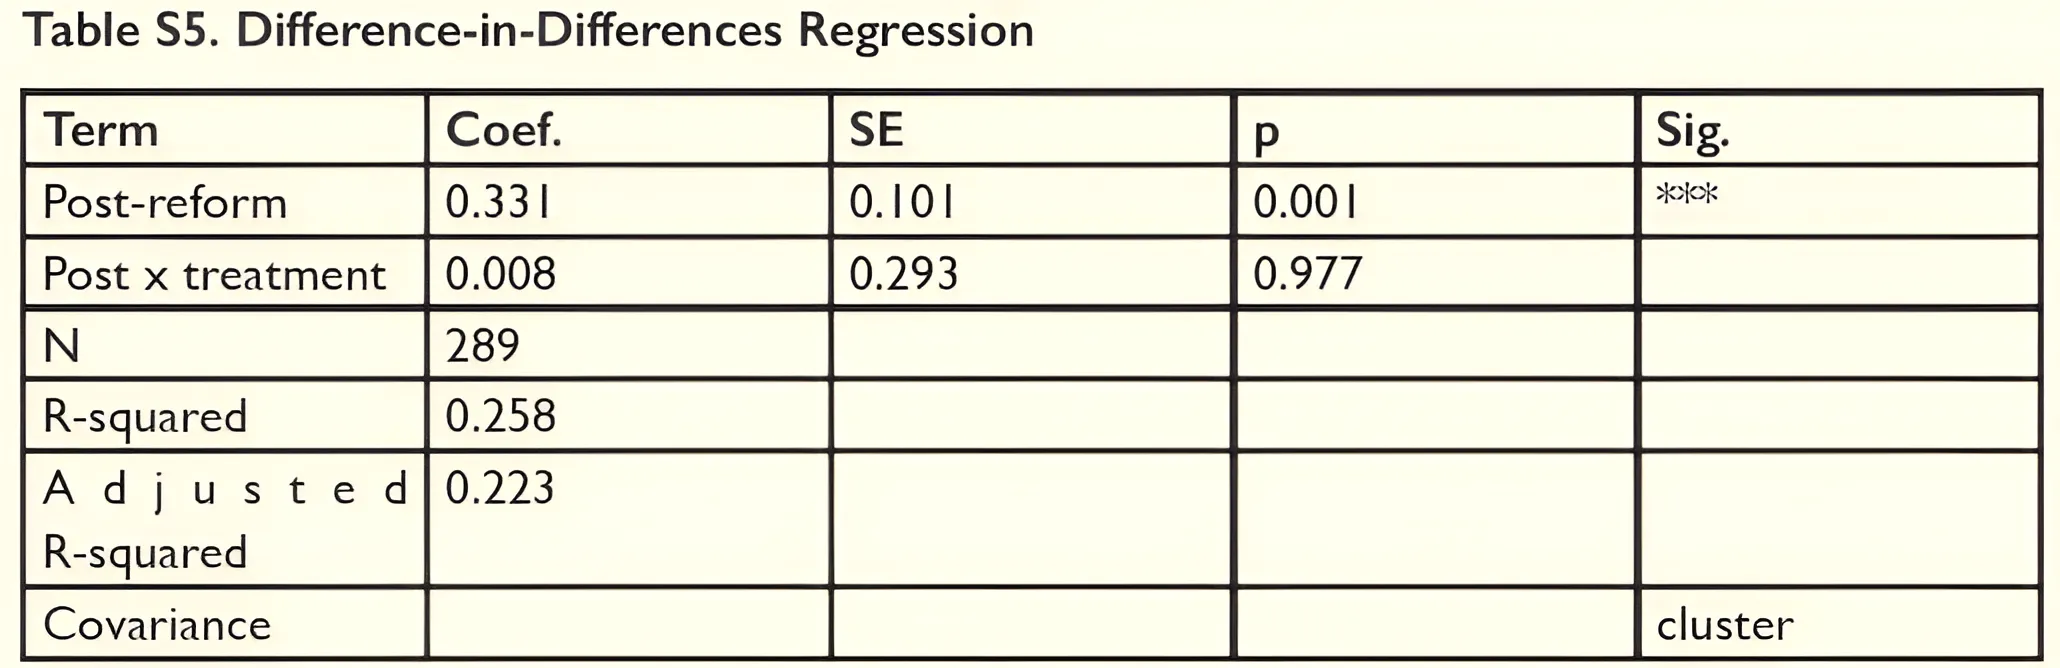
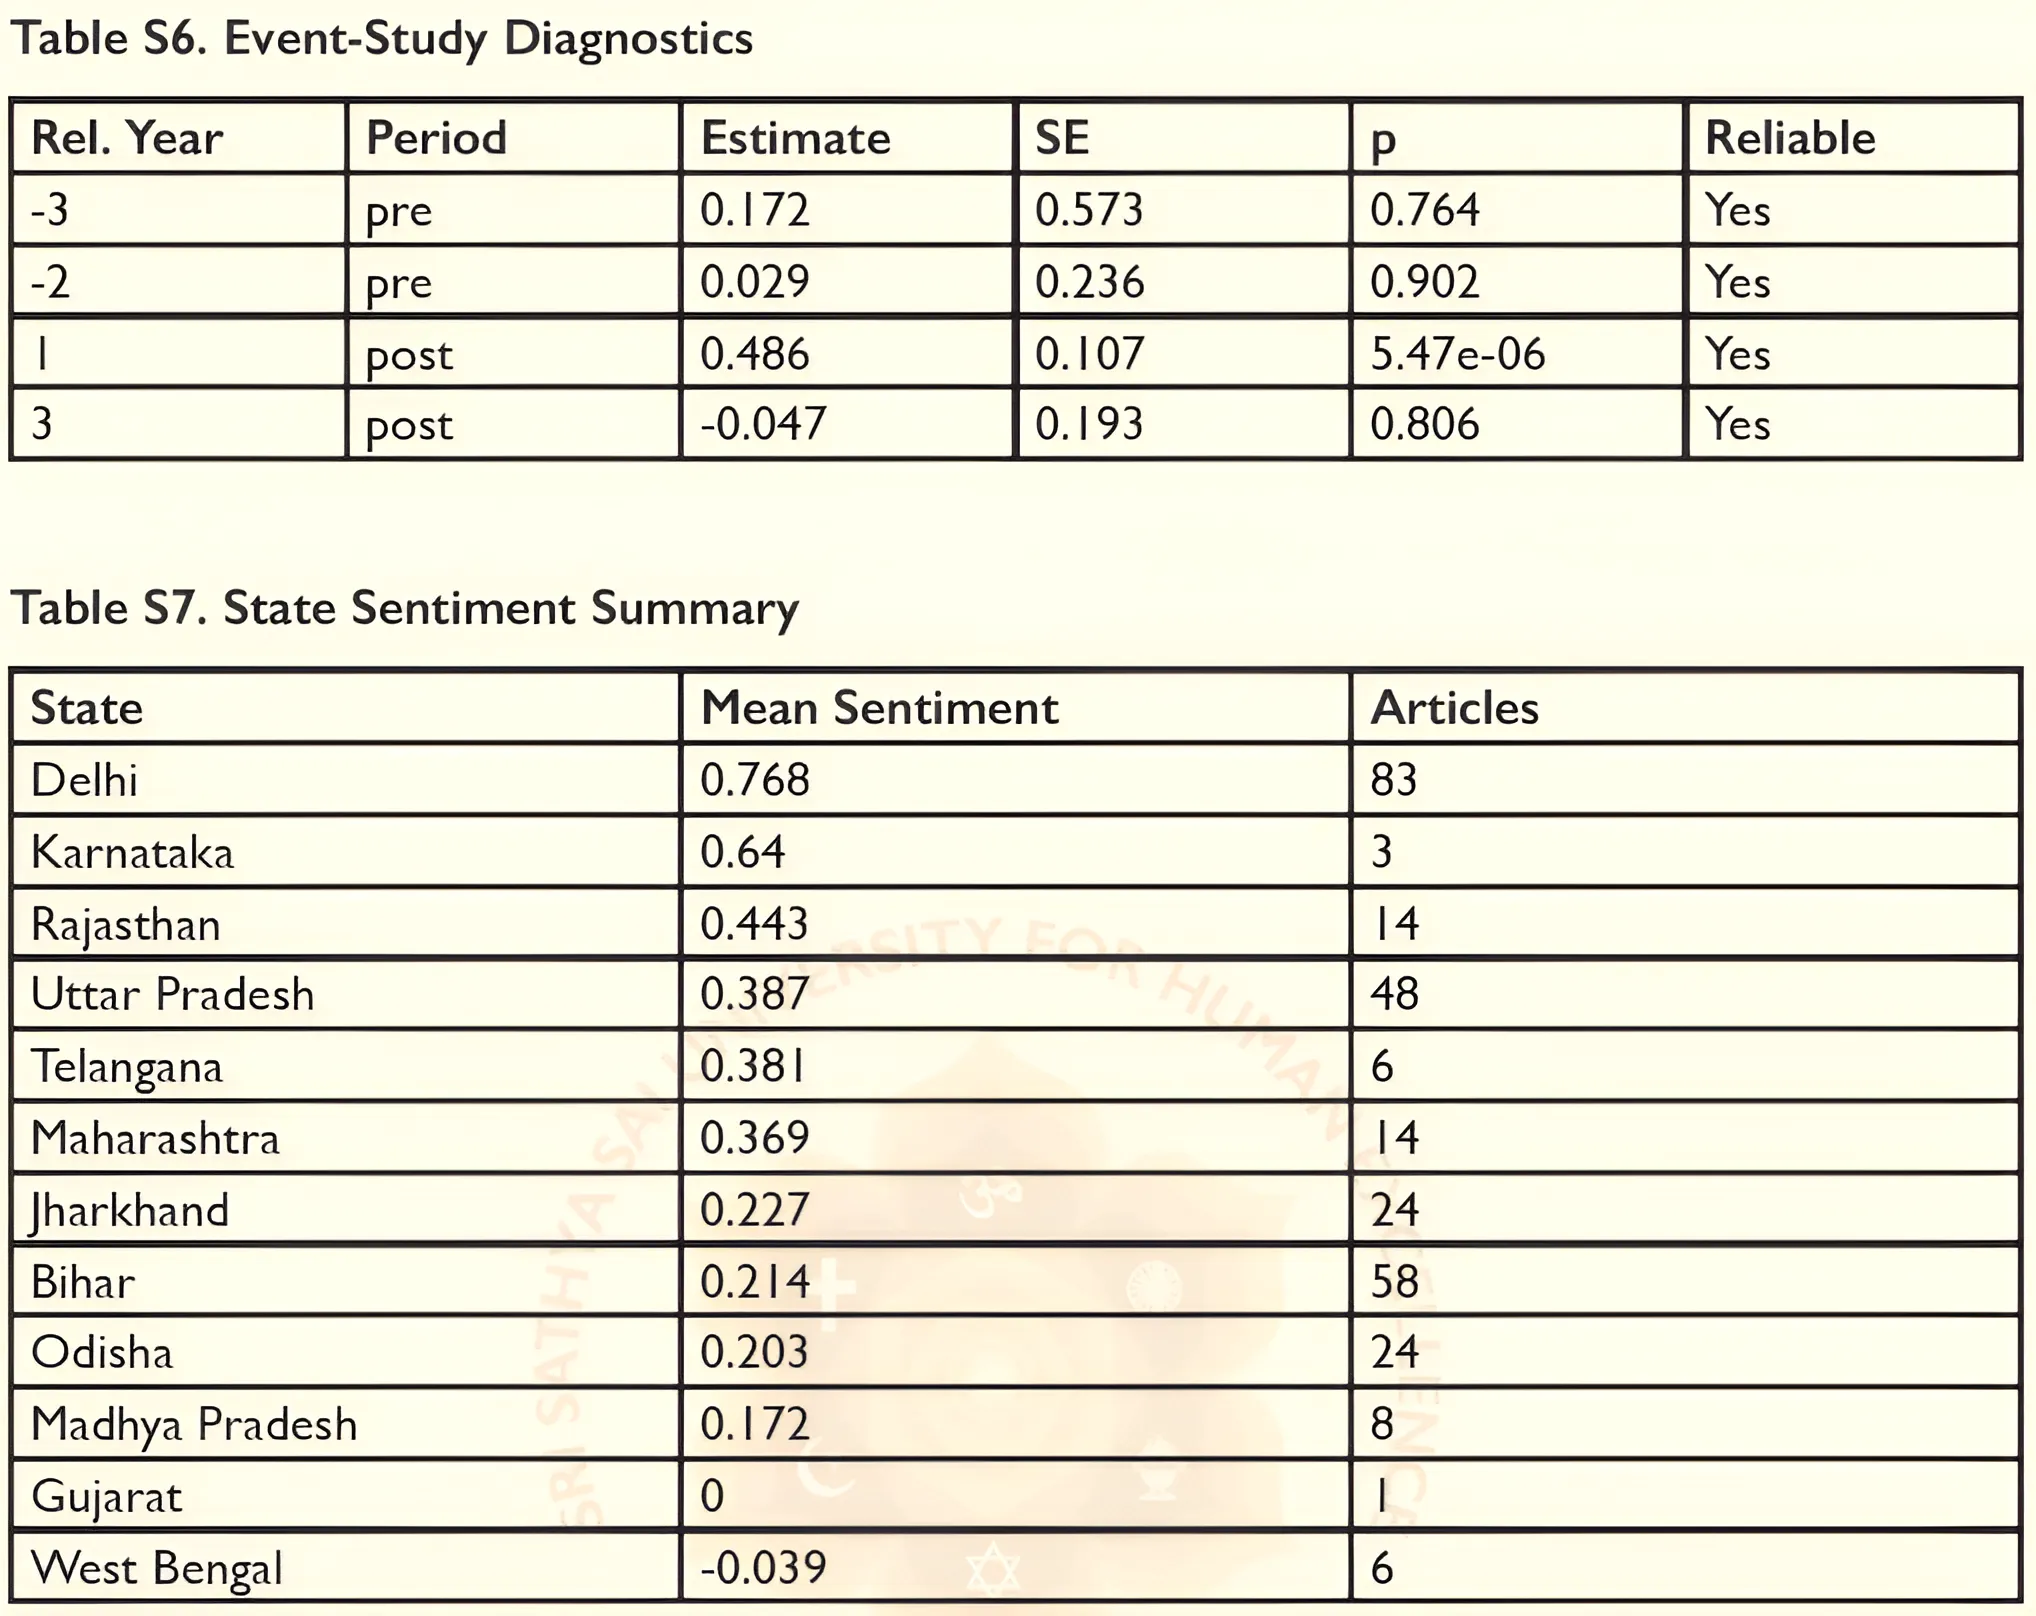
Note: Moran's 1=0.1121=0.112 across ll shapefile-matched states.Telangana appears in this table but is excluded from Moran's I because it does not match the shapefile used for spatial weights.
Disclaimer/Publisher's Note: The statements, opinions and data contained in all publications are solely those of the individual author(s) and contributor(s) and not of SSSUHE and/or the editor(s). SSSUHE and/or the editor(s) disclaim responsibility for any injury to people or property resulting from any ideas, methods, instructions, or products referred to in the content.